


 JPY Action Bias: USDJPY, EURJPY, and CADJPY Emerge as Top Extremely Bullish Picks
  EUR/USD Slides After ECB Hold, Bearish Technicals Favor Rally Fades
  JPY Strength Alert: USDJPY, AUDJPY, EURJPY and CADJPY Turn Extremely Bullish
  Major Pairs Action Bias: USDCHF Emerges Extremely Bullish as EURUSD and GBPUSD Turn Deeply Bearish
  FxWirePro:NZD/USD edges higher as kiwi firms on hawkish RBNZ outlook
  FxWirePro: AUD/USD rallies on jobs surge, heads to test key resistance
  Major Pairs Bias: USDCHF Bullish While GBPUSD Turns Bearish
  FxWirePro: USD/CNY edges higher but bulls lack punch
  FxWirePro: EUR/AUD neutral in the near term, scope for downward resumption
  FxWirePro- Major Crypto levels and bias summary
  FxWirePro:USD/JPY hovers near a four-decade low
  NZDJPY Bullish Dip-Buy Setup: 93.60 Support Unlocks Path to 97
  AUDJPY Extends Four-Day Rally as Yen Weakness Fuels Fresh Buying Opportunity
  NZDJPY Dips Create Fresh Buy Opportunity as Key Support Holds
  FxWirePro: USD/CNY attracts selling interest, vulnerable to more downside
  FxWirePro: GBP/AUD bears maintain upper hand


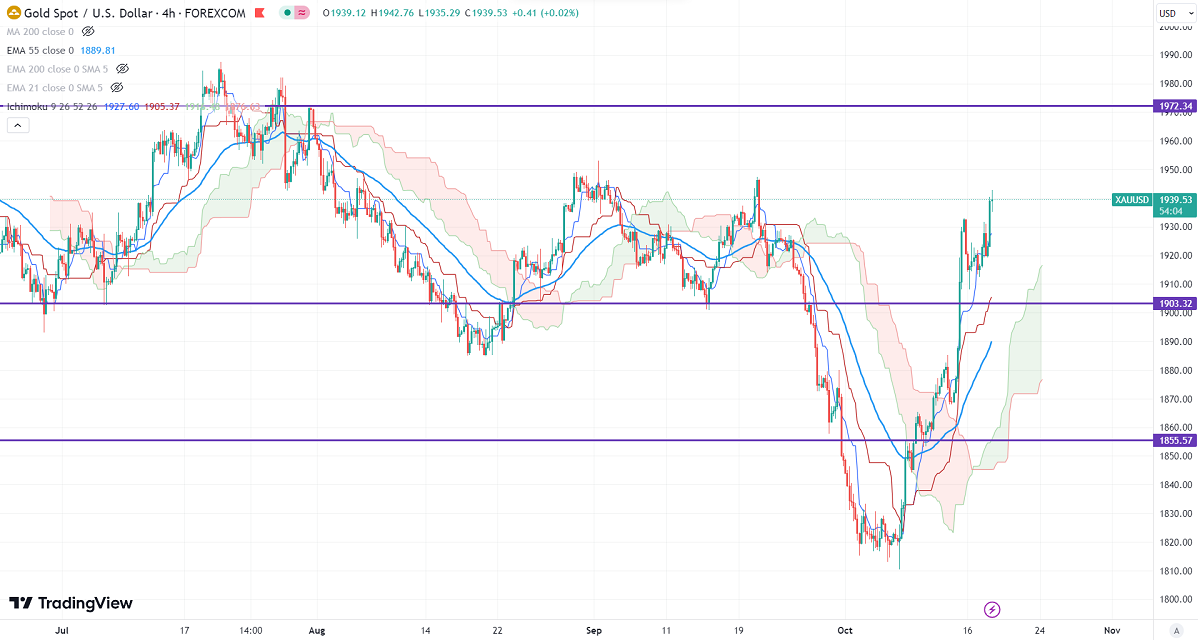
Ichimoku Analysis (4-hour chart)
Tenken-Sen- $1926.44
Kijun-Sen- $1904.21
The gold price showed a nice pullback despite strong US retail sales. It hit a high of $1942.75 and is currently trading at around $1938.14.
US retail sales surged sharply in Sep to 0.70%, above the estimate of 0.30%. Core retail sales excluding automobiles, gasoline, and building materials rose 0.60% vs. a Forecast of 0.20%.
Major economic data for the day
Oct 18, 2023, US Building permits (12:30 pm GMT)
US dollar index- Neutral. Minor support around 105.80/105. The near-term resistance is 106.60/107.50.
According to the CME Fed watch tool, the probability of a no-rate hike in Nov increased to 90.10% from 88% a week ago.
The US 10-year yield showed a minor pullback on upbeat US retail sales. The US 10 and 2-year spread narrowed to -36% from -75%.
Factors to watch for gold price action-
Global stock market- Bearish (positive for gold)
US dollar index - mixed (neutral for gold)
US10-year bond yield- Mixed (neutral for gold)
Technical:
The near–term support is around $1885, a break below targets of $1870/$1855/$1840/$1830. The yellow metal faces minor resistance around $1935 and a breach above will take it to the next level of $1950/$1970.
It is good to buy on dips around $1920 with SL around $1900 for TP of $1970.


