


 NZDJPY Dips Create Fresh Buy Opportunity as Key Support Holds
  FxWirePro: GBP/NZD gains some ground but outlook is bearish
  FxWirePro: EUR/NZD firms after ECB holds rates steady at 2.25%
  FxWirePro: GBP/NZD gains some upside momentum but still bearish
  FxWirePro: USD/CNY attracts selling interest, vulnerable to more downside
  Major Pairs Bias: USDCHF Bullish While GBPUSD Turns Bearish
  FxWirePro: AUD/USD uptrend loses steam, remains on bearish path
  FxWirePro: GBP/USD slips as middle east tensions and oil surge pressure pound
  Crypto Bias Report: Trend Signals and Top Bullish Picks
  JPY Strength Alert: USDJPY, AUDJPY, EURJPY and CADJPY Turn Extremely Bullish
  FxWirePro: USD/CNY edges higher but bulls lack punch
  FxWirePro: USD/CAD retreats slightly but trend is still bullish
  FxWirePro:NZD/USD edges higher as kiwi firms on hawkish RBNZ outlook
  EUR/USD Slides After ECB Hold, Bearish Technicals Favor Rally Fades
  FxWirePro: GBP/AUD bears maintain upper hand
  Major Pairs Action Bias: USDCHF Emerges Extremely Bullish as EURUSD and GBPUSD Turn Deeply Bearish
  FxWirePro- Woodies pivot (Major)


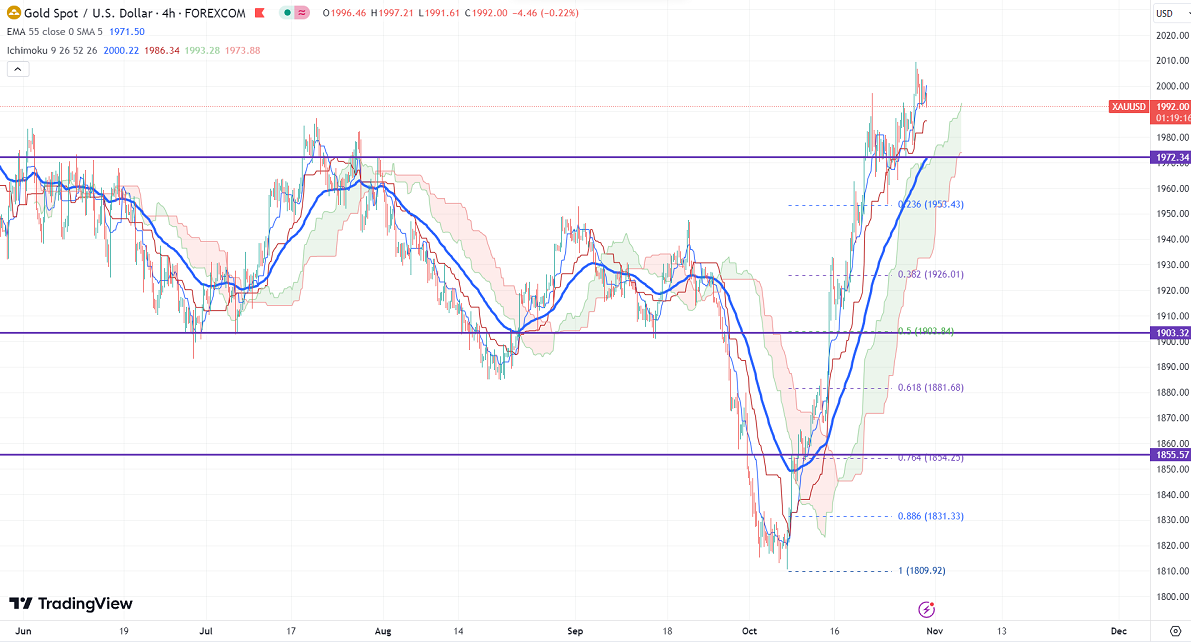
Ichimoku Analysis (4-hour chart)
Tenken-Sen- $1994.06
Kijun-Sen- $1986.34
Gold pared some of its gains on improved risk appetite. It hit a high of $2009.42 yesterday and is currently trading at around $1991.80.
Markets eye development in Middle east as war between Israel and Hamas intensifies.
Major Economic data for the day
Oct 31st, 2023, Employment cost index q/q (12:30 pm GMT)
S&P/CS Composite -20 HPI y/y (1 pm GMT)
Chicago PMI and CB consumer confidence (1:45 and 2 p.m. GMT)
US dollar index- Bullish. Minor support around 105/104.50. The near-term resistance is 107.50/109.
According to the CME Fed watch tool, the probability of a no-rate hike in Nov decreased to 98.3% from 98.9% a week ago.
The US 10-year yield declined slightly on easing geopolitical tension. The US 10 and 2-year spread narrowed to -16.20% from -75%.
Factors to watch for gold price action-
Global stock market- Bearish (positive for gold)
US dollar index - Bullish (Negative for gold)
US10-year bond yield- Bullish (Negative for gold)
Technical:
The near–term support is around $1975, a break below targets of $1960/$1950/$1926. The yellow metal faces minor resistance around $2010 and a breach above will take it to the next level of $2020/$2048.
It is good to buy on dips around $1970-72 with SL around $1960 for TP of $2000/$2020.


