Gold -
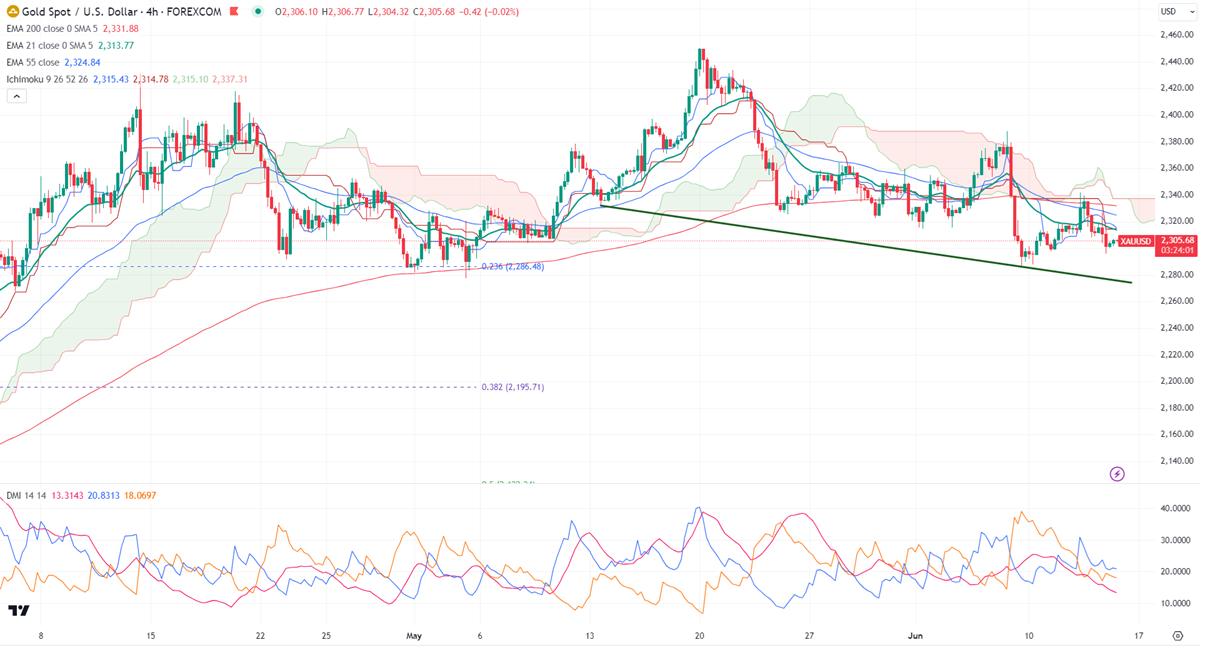
Ichimoku Analysis (4 Hour chart)
Tenken-Sen- $2317.66
Kijun-Sen- $2314.29
Gold declines during US session yesterday despite weak US PPI data. It hit a low of $2341 yesterday and is currently trading around $2314.05.
Economic data
US PPI - weak (positive for gold)
US jobless claims - negative (bearish for gold)
The yellow metal lost its shines after Fed dot plot shows that Fed is planning for one rate cut this year from three rate cut projected previously.
According to the CME Fed watch tool, the probability of a 25 bpbs rate cut in Sep increased to 59% from 55.40% a week ago.
US dollar index- Bullish. Minor support around 104/103. The near-term resistance is 105.50/107.
Factors to watch for gold price action-
Global stock market- Bullish (negative for gold)
US dollar index - Bullish (negative for gold)
US10-year bond yield- Bearish (Positive for gold)
Technical:
The near–term support is around $2280, a break below the target of $2270/$2250/$2228. The yellow metal faces minor resistance around $2320 and a breach above will take it to the next level of $2340/$2350/$2375.
It is good to sell on rallies around $2315-18 with SL around $2340 for TP of $2252.