
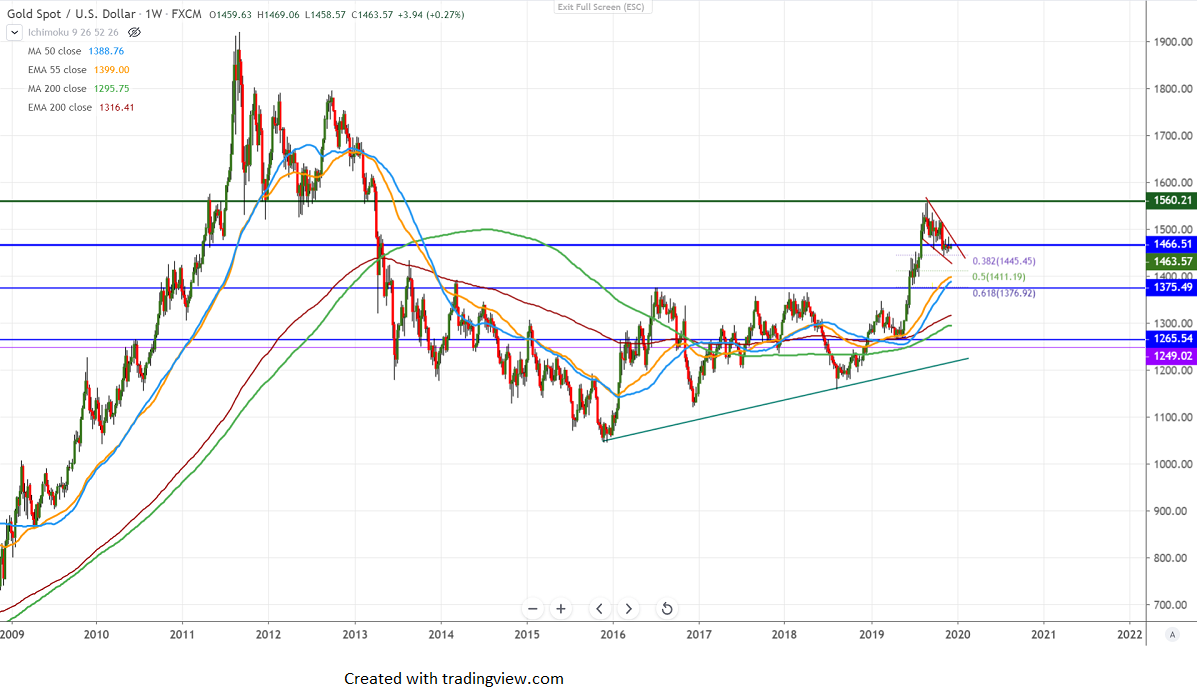
Chart pattern formed- Bullish flag
Gold was one of the best performers this year and jumped more than 20% till $1556. The jump was mainly due to ongoing trade war between the US and China which has increased demand for Safe-haven assets like the gold, yen. The three rate cut by Fed this year also supported the yellow metal prices at a lower level. It is currently trading around $1463.19.
US 10-year yield is trading lower for the past 1- year and declined more than 50% to 1.428%. The yield curve got inverted in the month of Aug 2019 for the first time since 2007. The spread between US 10-year and 2-year narrowed to 19.9 bps.
On the flip side, near-term support stands at $1445, violation below will drag the yellow metal down till $1398/$1380.
The near-term resistance is at $1485, any indicative break above targets $1500/$1525.
It is good to buy only above $1485 with SL around $1465 for the TP of $1550.


