
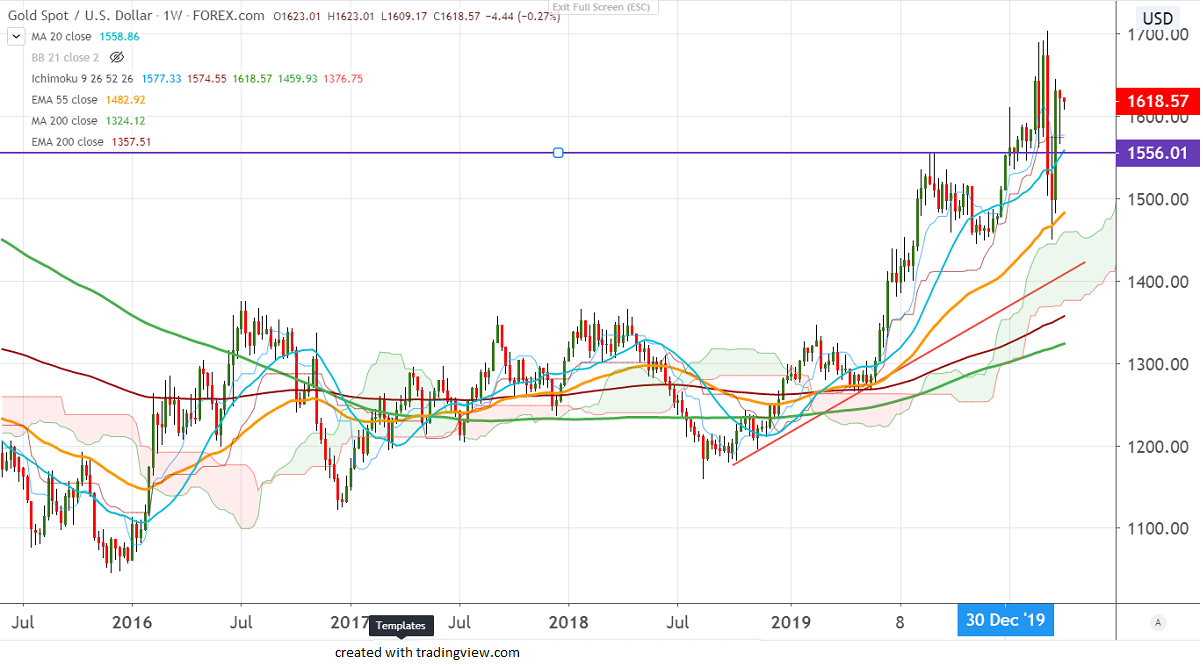
Ichimoku Analysis (Weekly Chart)
Tenken-Sen- $1577
Kijun-Sen- $1574
Chart pattern- Hanging Man (inside chart)
Gold has shown a nice recovery from low of $1567 and jumped till $1632.90. The recovery came due to Safe-haven demand and weak US jobs data. US economy has lost 701000 jobs in Mar compared to the forecast of 100000, while the unemployment rate jumped to 4.4% vs 3.8%.
The total number of people infected due to coronavirus rose to 1274346 with the U.S is in the top with 336830 and major European economies like Spain, Italy and Germany crossed 1 lakh.
On the flip side, near term support is at $1600 and any violation below will drag the yellow metal down till $1570/$1550.
The immediate resistance is around $1645 and indicative break above targets $1660/$1680.
It is good to buy on dips at $1600 with SL around $1580 for the TP of $1660.


