
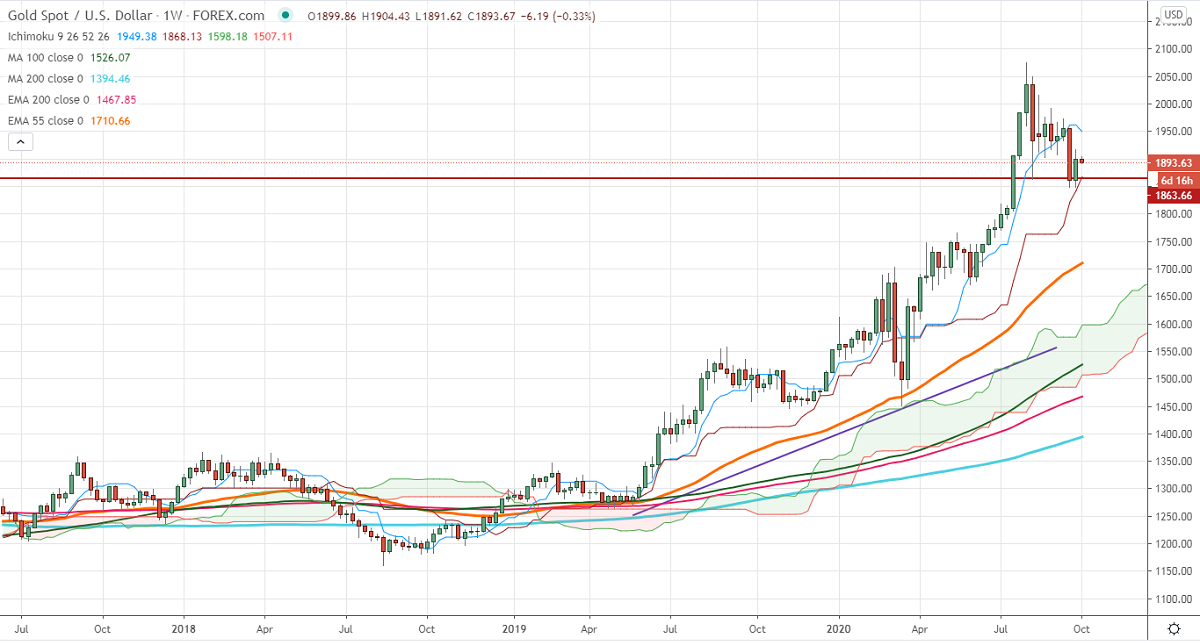
Ichimoku Analysis (Weekly Chart)
Kijun-Sen- $1961.95
Tenken-Sen-$1842
Gold was trading steady previous week after the White House reported coronavirus for US President Donald Trump. The jump in the US dollar has prevented the yellow metal from further gains. DXY shown a minor pullback till 94.03 and Trump's health improvement has dragged it further down till 93.70. The US economy has added 661000 jobs compared to an estimate of 900K. The unemployment rate declined to 7.9% from 8.2%. The yellow metal made a high of $1917 in the previous week and is currently trading around $1894.
The yellow metal is facing strong resistance at $1920. toviolation above will take to the next level till $1940/$1975. The near term support is around $1860, an indicative break below $1848 will take the commodity till $1825/$1800.
It is good to buy on dips at around $1880 with SL around $1860 for the TP of $1950.


