
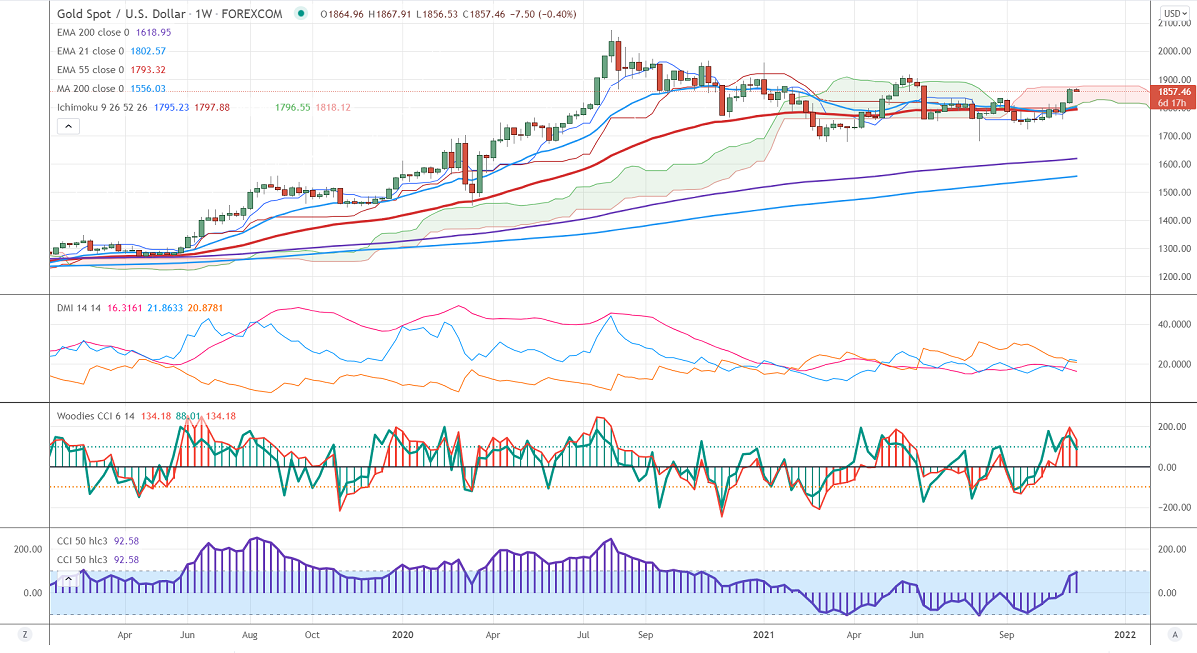
Ichimoku analysis (Weekly chart)
Tenken-Sen- $1795
Kijun-Sen- $1797.88
Gold has halted its two weeks of a winning streak and lost more than $20 from a 4-months high. The surge in US inflation has increased hopes of a rate hike by the Fed. The US dollar index surged sharply and hit a 16-month high at 95.26, showing a minor profit-booking. Gold hits a high of $1868 and is currently trading around $1859.
Economic data-
US CPI rose 0.9% in October compared to a forecast of 0.90%. The 12-month inflation surged to 6.2%, the biggest gain since 1990. The number of people who have filed for unemployment benefits fell by 4000 last week to 267000, the lowest level since the pandemic.
Factors to watch for gold price action-
Global stock market- Slightly bullish (negative for gold)
US dollar index –Bullish (negative for gold)
US10-year bond yield- Bullish (negative for gold)
Technical:
It faces strong support at $1840 violation below targets $1820/$1798/$1780. Significant trend continuation only below $1675. The yellow metal is holding above $1870, a jump till $1900/1915 is possible.
It is good to sell on rallies around $1860-61 with SL around $1871 for TP of $1800.


