


 FxWirePro: AUD/USD gains on Iran-US truce hopes, risk rally
  FxWirePro: USD/CAD gaining momentum for a move towards 1.4200 level
  FxWirePro: NZD/USD edges lower, remains on back foot
  FxWirePro: AUD/USD dips after RBA Governor speech
  GBPJPY Slips After Sterling Weakness, Bears Eye 216
  FxWirePro: NZD/USD gains as U.S.-Iran peace hopes boost risk sentiment
  FxWirePro: GBP/USD downtrend loses steam but outlook still bearish
  JPY Action Bias: USDJPY Emerges as the Clear Bullish Pair to Watch Amid Mixed Crosses
  FxWirePro: USD/CAD positions for another climb, eyes 1.4150 level
  FxWirePro : USD/JPY holds relatively bid on 163 ahead Of FOMC,BoJ meetings
  FxWirePro: GBP/NZD gains some ground but bias is still bearish
  JPY Action Bias: Bullish Pairs to Watch Out For
  Major Pairs Action Bias: USDCAD and USDCHF Stand Out as Extremely Bullish While GBPUSD and NZDUSD Turn Extremely Bearish
  FxWirePro :USD/JPY eases slightly, remains on bullish path
  Major Pair Action Bias: Bullish Pairs to Watch Out For
  FxWirePro: USD/ZAR uptrend loses steam, remains on bullish path


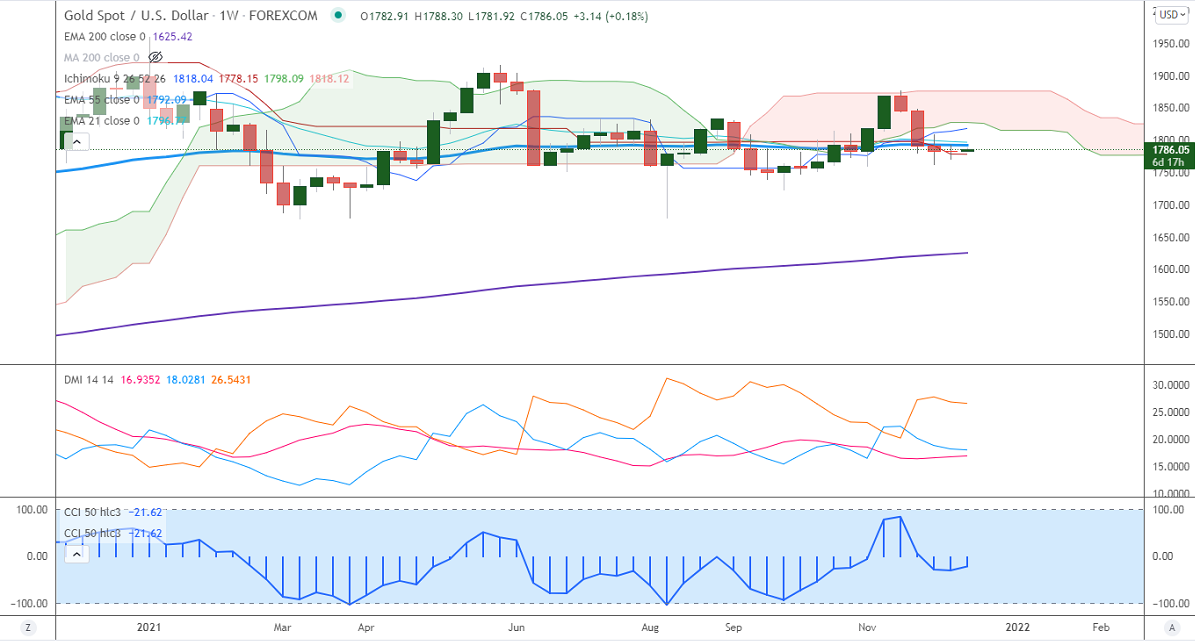
Ichimoku analysis (Weekly chart)
Tenken-Sen- $1811.45
Kijun-Sen- $1791.45
Gold is trading flat for the second consecutive week between $1793 and $1761. Easing of Omicron virus concerns and hopes of tapering by fed preventing yellow metal from further upside. The US dollar index has formed a lower high and higher low. Markets eye Fed monetary policy for direction The yellow metal hits a high of $1789 and is currently trading around $1786.78.
Economic data- US CPI surged 6.8% in November, the fastest level since 1982. The number of people who have filed for unemployment benefits declined to 184000 for the week ended Dec 4, the lowest level since Sep 6, 1969.
Factors to watch for gold price action-
Global stock market- Bullish (Positive for gold)
US dollar index –Bullish (negative for gold)
US10-year bond yield- neutral (mixed for gold)
Technical:
It faces strong support at $1760, violation below targets $1740/$1700.Significant trend continuation only below $1675. The yellow metal facing strong resistance $1792, any violation above will take to the next level $1800/$1815/$1835/$1860/$1900 is possible.
It is good to sell on rallies around $1800-01 with SL around $1815 for TP of $1762/$1740.


