


 NZDJPY Action Bias: Bullish Dip-Buying Opportunity on Broad Yen Weakness
  AUDJPY Extends Four-Day Rally on Yen Weakness: Bullish Dip-Buy Eyes 117-118
  Major Pairs Action Bias: USDCHF Emerges Extremely Bullish as EURUSD and GBPUSD Turn Deeply Bearish
  AUDJPY Action Bias: Bullish Dip-Buy Setup Despite Flat Neutral Bias
  FxWirePro: EUR/NZD downside pressure builds, key support level in focus
  JPY Action Bias: Bullish Pairs to Watch Out For
  FxWirePro: USD/CAD positions for another climb, eyes 1.4150 level
  FxWirePro: GBP/AUD under pressure as pound continues to weaken
  FxWirePro- Major Pair levels and bias summary
  FxWirePro :USD/JPY eases slightly, remains on bullish path
  FxWirePro:USD/JPY hovers near a four-decade low
  FxWirePro: USD/CNY dips as yuan firms on improving risk appetite
  FxWirePro: AUD/USD gains on Iran-US truce hopes, risk rally
  FxWirePro- Major Crypto levels and bias summary
  GBPJPY Slips After Sterling Weakness, Bears Eye 216
  FxWirePro- Major Crypto levels and bias summary
  FxWirePro: GBP/NZD downside pressure builds, key support levels in focus


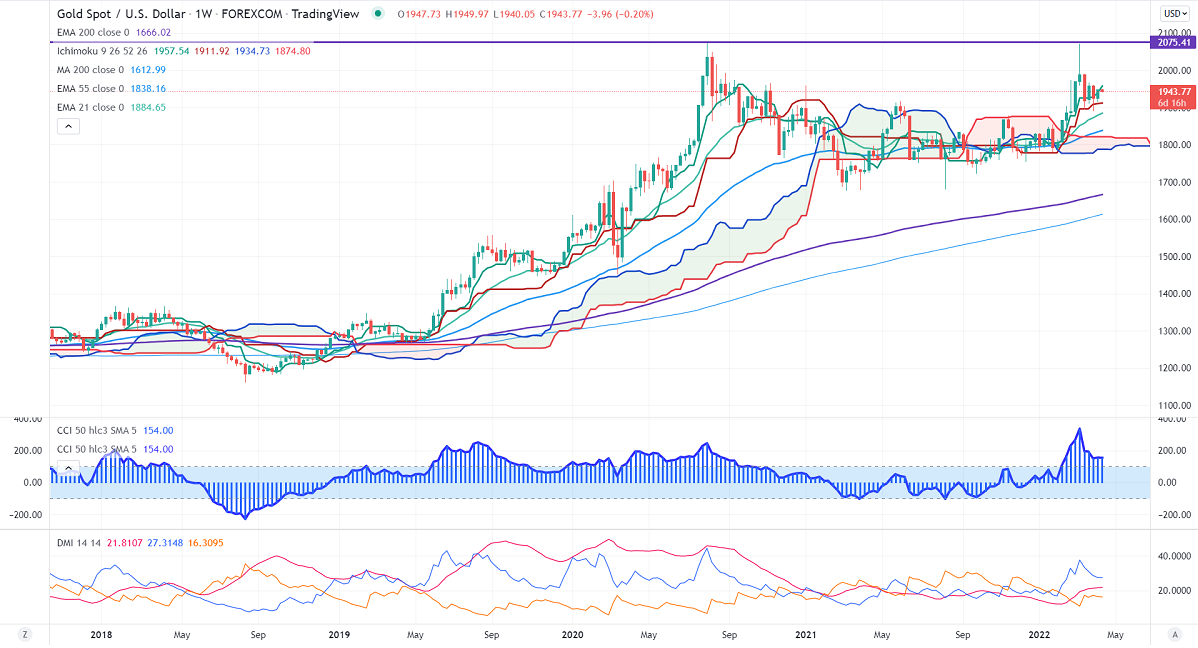
Ichimoku Analysis (Weekly chart)
Tenken-Sen- $1939
Kijun-Sen- $1910.25
Gold hits fresh month high despite surging US yield and dollar. The dollar index performed well against all majors after the Fed meeting minutes. The central bank revealed a plan for Quantitative tightening of USD 95 billion per month from May. US 10-year yield jumped sharply and hits the highest level since 2019. The yellow metal made an intraday high of $1949.95 and is currently trading around $1943.86.
The number of people who have filed for unemployment benefits declined to 166000 last week vs. an estimate of 201K.
Factors to watch for gold price action-
Global stock market- Flat (Neutral for gold)
US dollar index –Bullish (negative for gold)
US10-year bond yield- Bullish (negative for gold)
Technical:
The near–term support is around $1928, violation below targets $1915/$1910/$1900/$1890. Significant reversal only below $1890. A dip to $1850/$1800 is possible. The yellow metal faces strong resistance of $1950, any breach above will take to the next level $1960/$1977/$2000/$2020.
It is good to sell on rallies around $1948-49 with SL around $1965 for TP of $1850.


