


 JPY Action Bias: Bullish Pairs to Watch Out For
  AUDJPY Extends Four-Day Rally on Yen Weakness: Bullish Dip-Buy Eyes 117-118
  FxWirePro- Woodies pivot (Major)
  FxWirePro: USD/CNY edges higher but bulls lack punch
  FxWirePro: AUD/USD uptrend loses steam, remains on bearish path
  FxWirePro: GBP/AUD under pressure as pound continues to weaken
  FxWirePro: EUR/NZD firms after ECB holds rates steady at 2.25%
  FxWirePro: USD/CNY dips as yuan firms on improving risk appetite
  FxWirePro: GBP/NZD gains some ground but outlook is bearish
  FxWirePro: EUR/AUD neutral in the near term, scope for downward resumption
  FxWirePro: NZD/USD gains as U.S.-Iran peace hopes boost risk sentiment
  FxWirePro: AUD/USD gains on Iran-US truce hopes, risk rally
  FxWirePro- Major Crypto levels and bias summary
  FxWirePro: EUR/NZD downside pressure builds, key support level in focus
  NZDJPY Action Bias: Bullish Dip-Buying Opportunity on Broad Yen Weakness
  Major Pair Action Bias: Bullish Pairs to Watch Out For


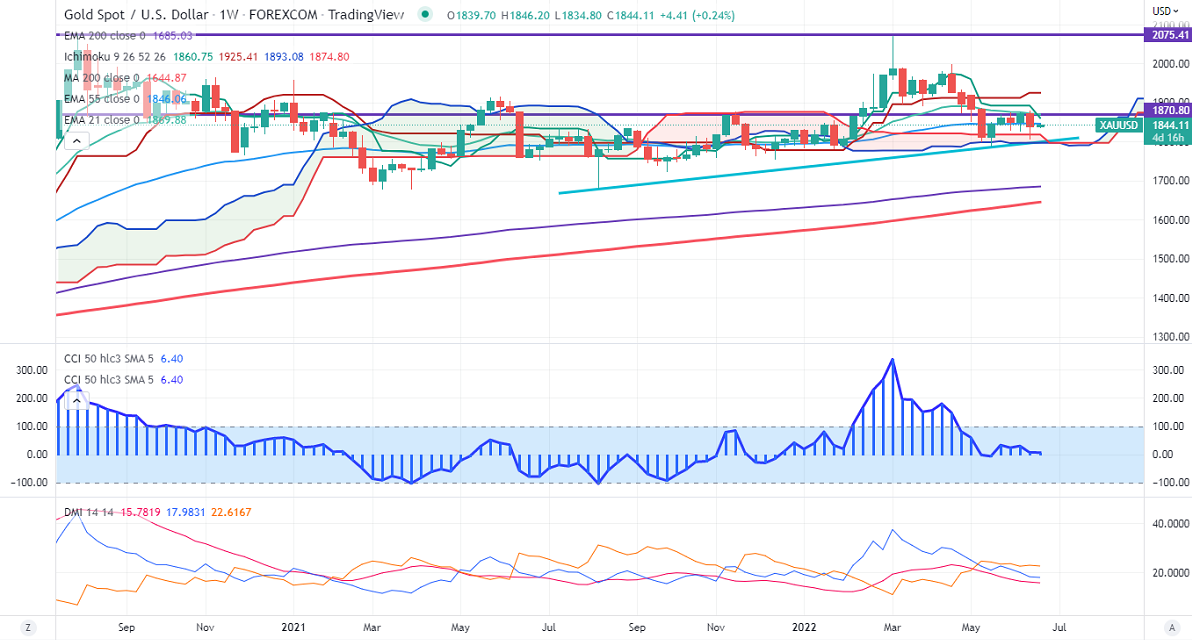
Ichimoku Analysis (Weekly chart)
Tenken-Sen- $1892.66
Kijun-Sen- $1925.41
Gold traded in a narrow range the previous week despite hawkish Fed policy. The central bank hiked rates by 75bpbs, the biggest increase since 1994. The Fed's "dot plot" shows that the projection for the federal funds rate for this year moved to 3.4%. It has cut its GDP to 1.7% from 2.8% in 2022, 1.7% from 2.2% in 2023. US dollar index pared some of its gains after forming a top 105.08. The minor sell-off in US treasury yields also supports the yellow metal at lower levels. It hits a low of $1805 the previous week and is currently trading around $1844.10.
Factors to watch for gold price action-
Global stock market- Bearish (Positive for gold)
US dollar index –Bullish (negative for gold)
US10-year bond yield- Bullish (negative for gold)
Technical:
The near–term support is around $1830, a breach below targets $1820/$1780/$1750. Significant reversal only below $1750. A dip to $1700/$1689 is possible. The yellow metal faces strong resistance of $1860, any breach above will take it to the next level of $1880/$1900/$1920.
It is good to sell on rallies around $1850 with SL around $1861 for TP of $1750.


