


 AUDJPY Extends Four-Day Rally on Yen Weakness: Bullish Dip-Buy Eyes 117-118
  FxWirePro- Woodies pivot (Major)
  FxWirePro: EUR/AUD neutral in the near term, scope for downward resumption
  Crypto Bias Report: Trend Signals and Top Bullish Picks
  FxWirePro: GBP/USD downtrend loses steam but outlook still bearish
  FxWirePro: USD/CAD edges lower but bullish outlook persists
  FxWirePro: USD/ZAR retreats slightly but bias is bullish
  FxWirePro: USD/ZAR surges as rand slumps after SARB rate hold surprise
  FxWirePro: GBP/USD slips as middle east tensions and oil surge pressure pound
  FxWirePro:USD/JPY hovers near a four-decade low
  FxWirePro: GBP/NZD gains some ground but outlook is bearish
  FxWirePro: GBP/AUD under pressure as pound continues to weaken
  FxWirePro: EUR/NZD firms after ECB holds rates steady at 2.25%
  FxWirePro- Major Pair levels and bias summary
  FxWirePro- Major Crypto levels and bias summary
  FxWirePro: AUD/USD uptrend loses steam, remains on bearish path


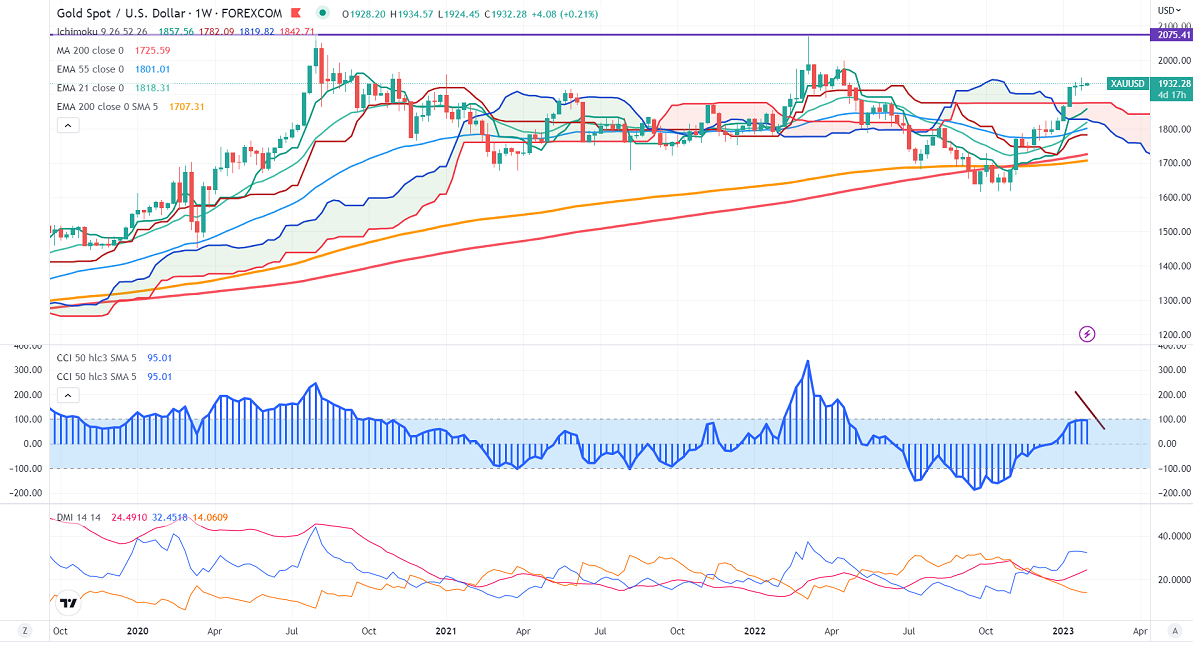
Ichimoku Analysis (Weekly chart)
Tenken-Sen- $1844.47
Kijun-Sen- $1782.07
Gold has traded in a narrow range between $1949 and $1916 for the past four days. The yellow metal showed a minor jump as US PCE rose 0.36% in Dec, above the previous month's 0.2%. It hits an intraday high of $1933.35 and is currently trading around $1933.40.
The US economy expanded at an annual rate of 2.9% in Q4, above expectations of 2.6%. The number of people who have filed for unemployment benefits in the week ending Jan 21 st compared to the forecast of 205K.
Markets eye to Fed, ECB, and BOE monetary policy report for further direction.
US dollar index- Bearish. Minor support around 101.50/100. The near-term resistance is 103.50/104.50.
According to the CME Fed watch tool, the probability of a 25 bpbs rate hike in Feb dropped to rose to 98.1% from 96.80% a week ago.
The US 10-year yield took support near 200-day MA and showed a minor jump. Any break and close below 3.26% confirm minor bearishness. The yield spread between 10 and 2-year narrowed to -70.6 basis points from -75 bpbs.
Factors to watch for gold price action-
Global stock market- bearish (bullish for gold)
US dollar index – Bearish (positive for gold)
US10-year bond yield- Bearish (Positive for gold)
Technical:
The near–term support is around $1890, a break below targets of $1865/$1825.The yellow metal faces minor resistance around $1935, and a breach above will take it to the next level of $1950/$1969.
It is good to buy on dips around $1890 with SL around $1880 for TP of $1935/$1950.


