


 Bank Regulation Rollbacks in the U.S. and UK Could Increase Financial Risks, Study Warns
  Silver Cracks Key 365-Day EMA for First Time Since Feb 2024; Bears Eye $50 on Rallies
  Goldman Sachs: US Dollar Likely to Stay Strong Despite Oil Price Retreat
  With Iran and the US signing a peace deal, where does that leave Benjamin Netanyahu?
  How Donald Trump has changed the way diplomacy is done
  Gold Surges Above Key EMAs, Bulls Eye Resistance Amidst Bullish Momentum
  How AI prompting turned writerly description into an everyday skill
  Gold's 365-Day EMA Streak Since Oct 2023 Faces Its First Real Test at $3,980 — Break or Bounce to $4,140?


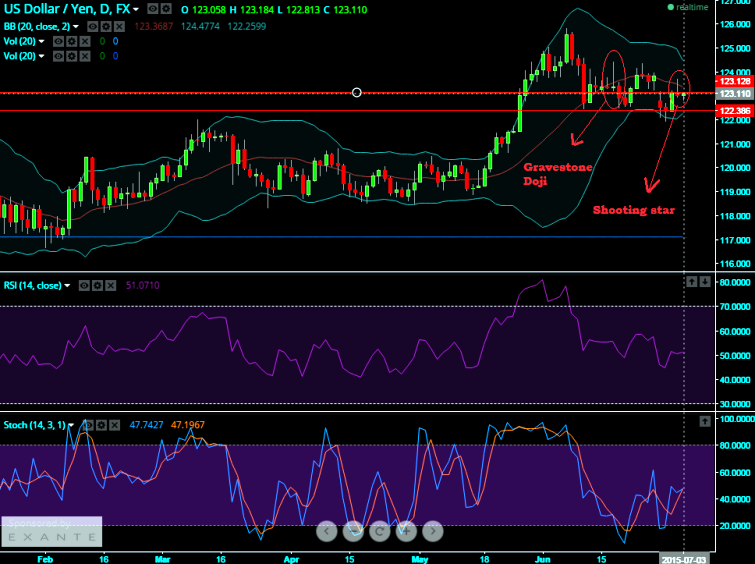
For today, technical charts suggest little sideways to upward but certainly the indication of weakness in this pair on EOD charts as an attempt of filling up of gap down that we had traced out with a spinning top candle pattern two days ago and more evidently these price patterns have been substantiated with abundant volumes.
And in addition we believe it has been testing support at 123.12 levels if it manages to break these levels then we see all chances of dragging towards 122 levels back again.
The Gravestone Doji at 123.410 levels followed by the next candle after doji also falls to the downside is a strong bearish confirmation that the earlier doji's signal of market topping would sustain and in addition to that shooting stars appeared yesterday at 123.016 to substantiate bearish trend to begin. We suspect around 123 levels are some negotiating points for investors.
On intraday day charts oscillating indicators such as RSI (14) and slow stochastic curves are moving in convergence with prevailing upswing price patterns.
RSI on intraday charts currently oscillating at 51.2569 while %K line cross over near 25 levels on slow stochastic which is not that significant for both bulls and bears.
We look at either shorting futures for pair to hit targets of 122.50 1st & then even 122 levels in medium term or buying binary puts at current prices can also be beneficial for the same targets with a strict stop loss at 123.50. Thereby risk reward ratio would be at 0.33.

- News

- Economy

- Central Banks
- Investing
- Research
- Roundups
- Digital Currency
- Insights
- Technical Analysis
- Technology
- Business
- Law
- Health
- Nature
- Fintech
- Science
- Topic
- Opinions
- ©Econometrics LLC . All Rights Reserved.
FxWirePro: Gravestone DOJI and shooting star signal USD/JPY weakness; short futures for target at 122.35
Friday, July 3, 2015 6:35 AM UTC
Editor's Picks


- Market Data
Most Popular


