


 AUDJPY Bullish Momentum Ignites: Buy Dips Toward 115 Target
  FxWirePro- Major Pair levels and bias summary
  AUDJPY Bullish Surge: Strong Australian Dollar Fuels Fresh Upside as Pair Holds Above 113.50 and All EMAs Align
  Gold Loses Steam After Strong U.S. Retail Sales
  FxWirePro:EUR/NZD stuck In narrow ranges, focus on near term support
  FxWirePro: USD/ZAR advances as South African rand weakens amid renewed Middle East tensions
  NZDJPY Bullish Setup: Buy Dips at 94.50 as Uptrend Holds Above All Key EMAs
  FxWirePro- Major Crypto levels and bias summary
  ETH Stands Alone Bullish; BTC, SOL, XRP, BNB Neutral


 - EconoTimes)


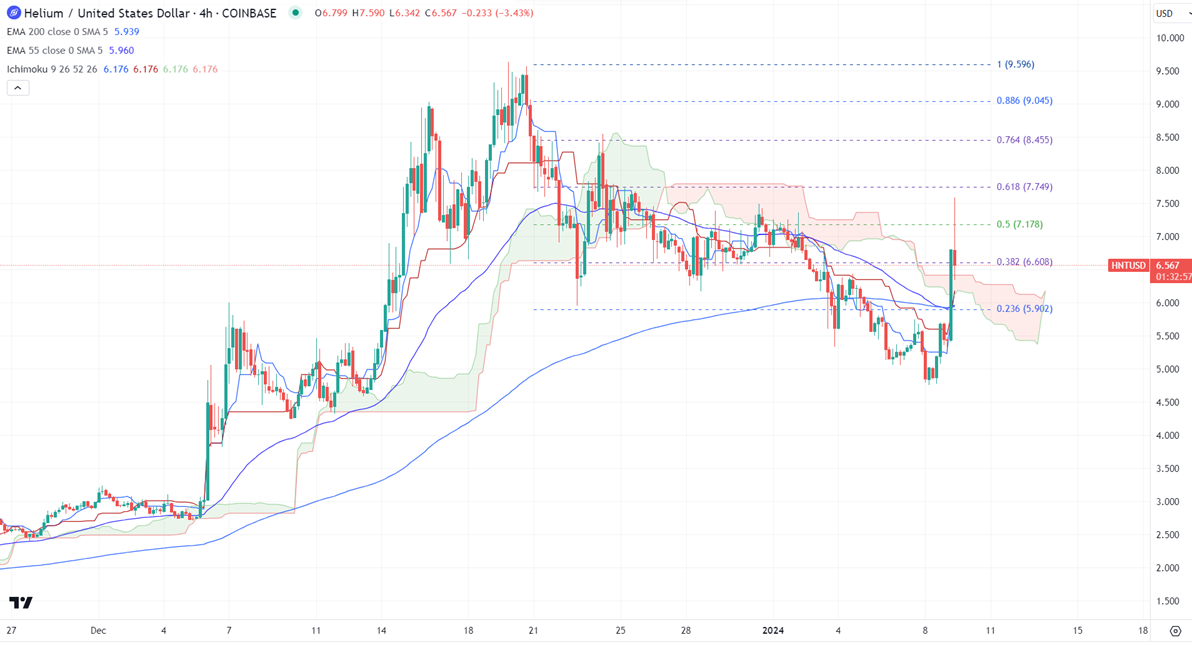
Ichimoku Analysis (4 hour chart)
Tenken-Sen- $5.78
Kijun-Sen- $5.78
HNTUSD performed well after a massive sell-off.
Any daily close above $7.60 confirms further bullishness.
HNTUSD lost more than 50% after forming a minor top around $9.63. The pair holds well above the short-term (21 and 55 EMA) and long-term moving average. It hit a high of $7.59 and is currently trading around $6.370.
The bullish invalidation can happen if the pair closes below $4.40. On the lower side, the near-term support is $5.95. Any break below targets $5.30/$4.75. Significant downtrend if it breaks $4.
The immediate resistance stands at around $7.60. Any breach above confirms a minor pullback. A jump to $8.45/$9.65 is possible. A surge past $10 will take it to $15.
It is good to buy on dips around $5.50 with SL around $4.35 for TP of $10.


