


 FxWirePro: Daily Commodity Tracker - 21st March, 2022
  Gold Prices Fall Amid Rate Jitters; Copper Steady as China Stimulus Eyed


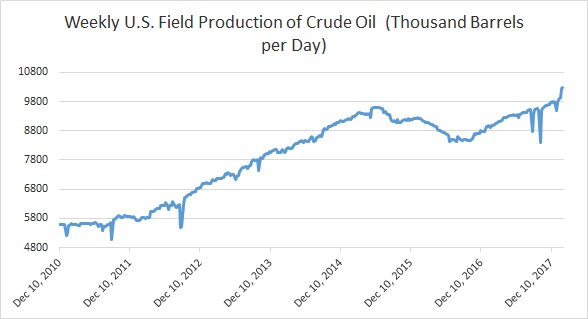
Here are some key charts based on data from United States’ Energy information Agency (EIA) that explains the level of inventories, refinery demand, and production.
- Chart 1 shows crude oil production in the United States which has reached an all-time high last year, rose sharply to 10.271 million barrels per day last week compared to 10.251 million barrels per day in the week before.
- Chart 2 has been making the refiners around the world cheer and filling OPEC with joy as it shows that distillate inventories have declined significantly and fallen to 5-year average. However, it has been rising over the past few weeks. However, last week, it declined to 141.37 million barrels.
- U.S. oil imports have been declining over the past couple of year. However, Chart 3 shows that imports declined last week to 7.89 million barrels per day.
- Chart 4 shows the level of U.S. crude oil exports, which has fallen from a record high of 2.113 million barrels per day. Last week export was 1.322 million barrels per day.
- Chart 5 shows U.S. refinery operating at 89.8 percent capacity.
- Chart 6 shows the level of crude oil inventories, which has declined around 110 million barrels since March 2017. However, inventories have risen for a fourth consecutive week to 422.09 million barrels.
FxWirePro launches Absolute Return Managed Program. For more details, visit http://www.fxwirepro.com/invest


