FxWirePro: Key charts explaining crude oil inventories and production report of EIA
Here are some key charts based on data from the United States’ Energy Information Agency’s (EIA) latest report that explains the level of inventories, refinery demand, and production. Chart 1 shows crude oil production i…
Here are some key charts based on data from the United States’ Energy Information Agency’s (EIA) latest report that explains the level of inventories, refinery demand, and production.
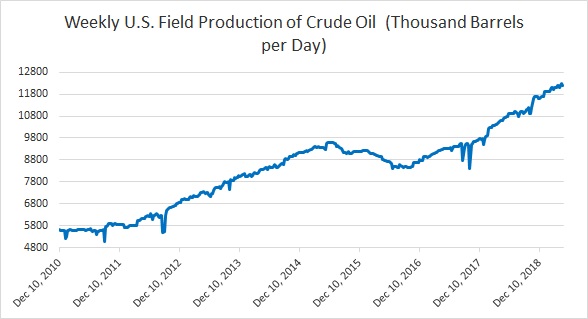
Chart 1 shows crude oil production in the United States reached a new record high of 12.3 million barrels per day last month. Last week, it was 12.2 million barrels per day.
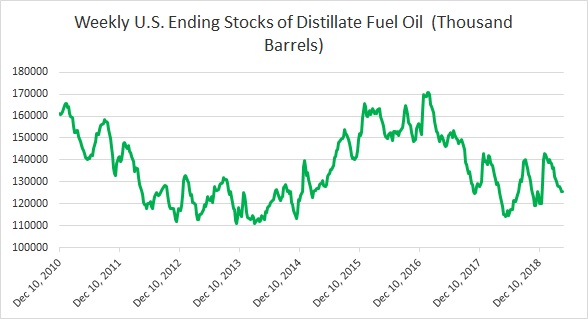
Chart 2 shows the level of U.S. distillate inventories. According to the latest report, the inventory declined last week to 125.6 million barrels.
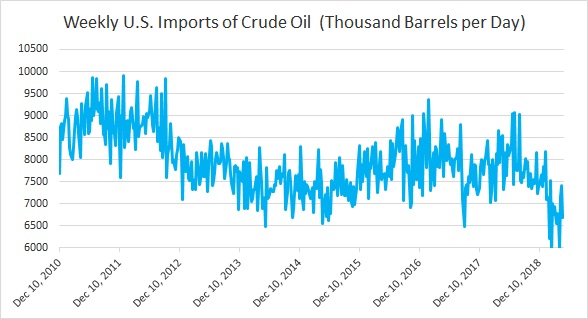
U.S. oil imports have been declining over the past couple of year. However, last week, it declined to 6.69 million barrels per day, largely due to lower refinery demand.
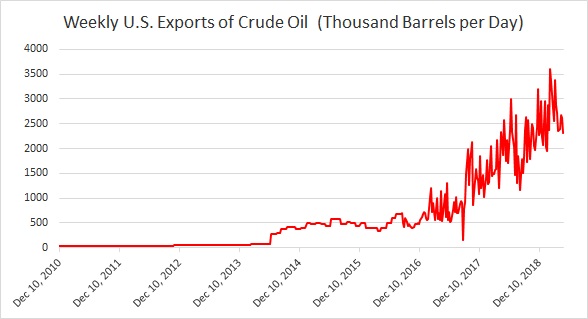
Chart 4 shows the level of U.S. crude oil exports, which rose to a new record high of 3.61 million barrels per day last month. Last week, it was 2.32 million barrels per day.
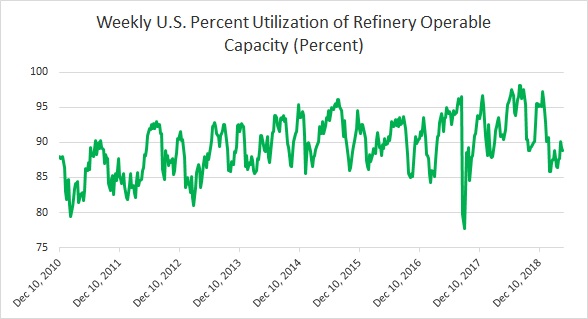
Chart 5 shows U.S. refinery operating at 88.9 percent. Refinery intake has taken a sharp dive from 97 percent in January but up from 85.9 percent in mid-February.
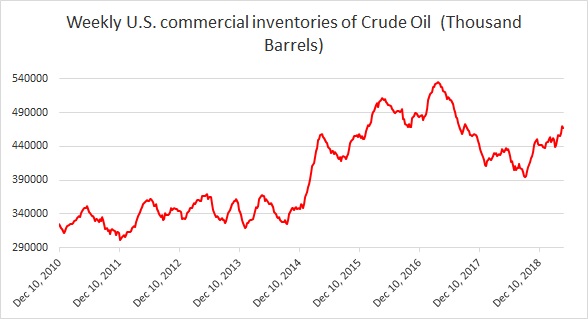
Chart 6 shows the level of crude oil inventories, which has declined around 81 million barrels since its peak in April 2017. Inventories declined last week to 466.6 million barrels.
Gold prices edged lower on Monday as stronger-than-expected U.S. nonfarm payrolls data dampened hopes for aggressive Federal Reserve rate cuts, bolstering the dollar. Spot gold slipped 0.1% to $2,686.32 an ounce, while F…
On-chain data shows BTC whales moved 10000 BTC from Crypto exchanges. This indicate accumulation of BTC by whales. Japanese public company Metaplanet buys another 1 billion yen worth of Bitcoin. According to Santiment, t…
Personal income increased by 0.2% month over month In August, which was less than the 0.4% market forecast and less than the 0.3% growth in July. For the third consecutive month, real personal disposable income increased…