


 World Cup technology: from ref cams to AI analysts, cutting-edge research is changing the game
  Gold's 365-Day EMA Streak Since Oct 2023 Faces Its First Real Test at $3,980 — Break or Bounce to $4,140?
  Trump’s Iran Strategy: What Has Been Achieved After Three Months of Conflict?
  How AI prompting turned writerly description into an everyday skill
  SpaceX Stock Gets $175 Target as Analysts See Massive Growth Ahead
  With Iran and the US signing a peace deal, where does that leave Benjamin Netanyahu?
  Today’s space race could turn fatal if we don’t agree on new rules
  AI Memory Boom Sparks Global Chip Supply Crunch
  China’s AI Manufacturing Boom Masks Weak Consumer Economy, Citi Says
  Morgan Stanley Sees Chinese Auto Market Recovery Gaining Momentum in Late Summer
  Silver Cracks Key 365-Day EMA for First Time Since Feb 2024; Bears Eye $50 on Rallies


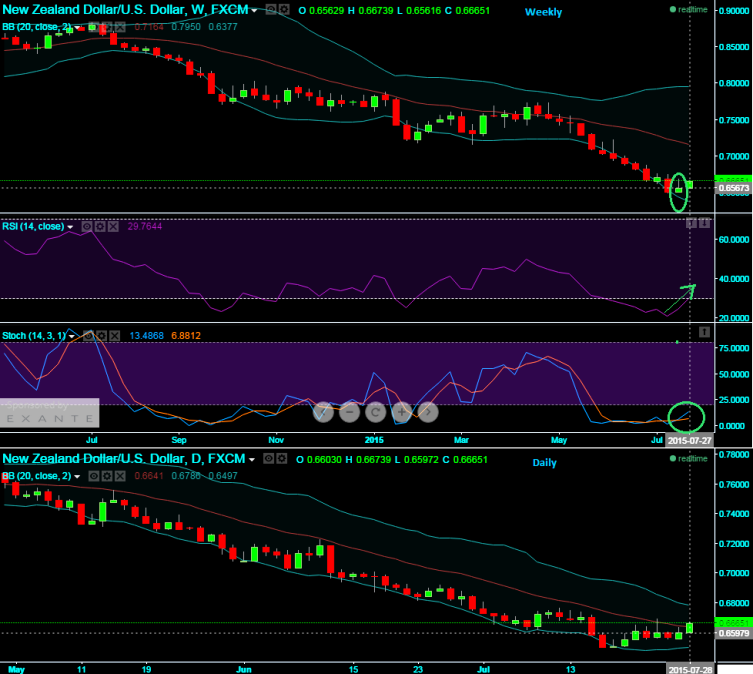
Kiwi dollar after continues losing streak that has begun from mid April now it is making an attempt of recovery a bit. On weekly charts, from last April the pair has been tumbling non-stop from the peaks at 0.7736 levels to evidence the huge loses.
An inverted hammer candle is occurred on weekly charts at the downswings and the trend on this chart has started showing short term reversal as the RSI (14) has reached oversold zone and is now converging upswings with every price spikes. While %K line crossover occurred below 20 levels on slow stochastic which is again an oversold territory.
RSI on weekly chart is converging upward at 29.9322, while %K line crossover on slow stochastic curve is seen below 20 levels which is oversold zone. (Currently, %K line trending at 13.6232 and %D line at 6.9151). Overall, Kiwi dollar after a long lasted losing streak that was started from last 1 year or so to hit almost 6 year's lows has now changed its direction. So far the major trend was downtrend dominated by the bears and now has been trend reversal signalled by technical indicators.

- News

- Economy

- Central Banks
- Investing
- Research
- Roundups
- Digital Currency
- Insights
- Technical Analysis
- Technology
- Business
- Law
- Health
- Nature
- Fintech
- Science
- Topic
- Opinions
- ©Econometrics LLC . All Rights Reserved.
FxWirePro: Leading oscillators signal NZD/USD’s short term trend reversal
Tuesday, July 28, 2015 6:29 AM UTC
Editor's Picks


- Market Data
Most Popular


