Home / Technicals / Article Technicals
Add as a preferred source on Google FxWirePro: NZD/CAD Near-Term Outlook NZD/CAD chart on Trading View used for analysis NZD/CAD is trading in a narrow range on the day, holds above 5-DMA support. The pair has been on an uptrend since beginning of October and has broken above 200W SMA. Price …
By FxWirePro Team Dec 11, 2018, 11:37 AM UTC
Image from the original EconoTimes article Read the original article
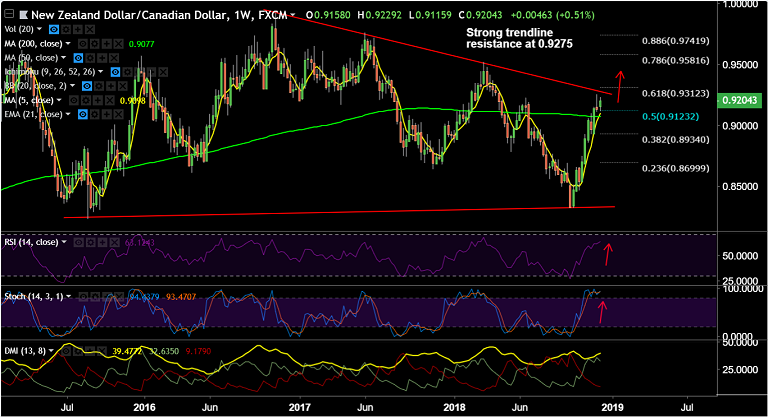
NZD/CAD chart on Trading View used for analysis
NZD/CAD is trading in a narrow range on the day, holds above 5-DMA support.
The pair has been on an uptrend since beginning of October and has broken above 200W SMA.
Price action extends in 'Falling Triangle' pattern and the pair is trading shy of Triangle top at 0.9280.
Momentum studies on weekly charts are biased higher. Break above Triangle Top could propel the pair higher.
That said, we see a bearish divergence on RSI and Stochs on the daily charts which keeps scope for minor pullbacks.
Immediate support lies at 5-DMA at 0.9192. Major weakness only below 200W SMA at 0.9077.
Breakout at Triangle Top eyes 78.6% Fib retracement at 0.7581.
Support levels - 0.9192 (5-DMA), 0.9085 (20-DMA), 0.9077 (200W SMA)Resistance levels - 0.9256 (Dec 6 high), 0.9280 (Triangle top), 0.93For details on FxWirePro's Currency Strength Index, visit http://www.fxwirepro.com/currencyindex .
Technicals EURUSD - Levels to watch - 1.1100 GBPUSD Levels to watch - 1.3180 USDCHF Levels to watch - 0.8365 USDCAD - Levels to watch - 1.4300 AUDUSD - Levels to watch - 0.7000 NZDUSD - Levels to watch - 0.5560
By FxWirePro Team Oct 15, 2026, 3:20 AM UTC
Technicals EURUSD - Levels to watch - 1.100 GBPUSD Levels to watch - 1.3180 USDCHF Levels to watch - 0.8400 USDCAD - Levels to watch - 1.4300 AUDUSD - Levels to watch - 0.7000 NZDUSD - Levels to watch - 0.5560
By FxWirePro Team Oct 15, 2026, 3:17 AM UTC
Technicals JPY Major Pair Currency Score: USDJPY, GBPJPY and AUDJPY Extremely Bearish
By FxWirePro Team Oct 15, 2026, 2:34 AM UTC