


 U.S. Treasury Yields Expected to Decline Amid Cooling Economic Pressures
  Indonesia Surprises Markets with Interest Rate Cut Amid Currency Pressure
  FxWirePro: AUD/USD drifts lower, uninspired by jobs beat
  FxWirePro: EUR/AUD bullish outlook with scope to target 1.6550
  FxWirePro: USD/ZAR remains buoyant, looks to extend gains
  Moldova Criticizes Russia Amid Transdniestria Energy Crisis
  NZDJPY Bears Reload as 92 Resistance Caps Bounce; Sell-on-Rallies Eyed Toward 90
  Moody's Upgrades Argentina's Credit Rating Amid Economic Reforms
  China's Refining Industry Faces Major Shakeup Amid Challenges
  Urban studies: Doing research when every city is different
  EURJPY Bounce Loses Steam Below 184 — Sell-the-Rally Setup Eyes 183 Target
  S&P 500 Relies on Tech for Growth in Q4 2024, Says Barclays
  European Stocks Rally on Chinese Growth and Mining Merger Speculation
  U.S. Banks Report Strong Q4 Profits Amid Investment Banking Surge
  Trump’s "Shock and Awe" Agenda: Executive Orders from Day One
  Geopolitical Shocks That Could Reshape Financial Markets in 2025
  AUDJPY Breaks Key Trendline Support — Bears Eye 110 as Momentum Accelerates


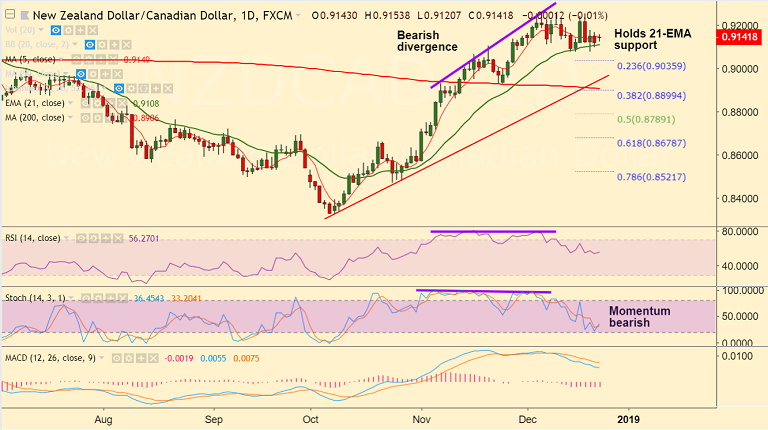
NZD/CAD chart on Trading View used for analysis
- NZD/CAD trades rangebound on the day at 0.9144 at the time of writing.
- The pair is extending sideways grind at strong support at 21-EMA. Break below will see further weakness.
- Technical indicators are biased lower for the day and bearish divergence on RSI and Stochs keeps scope for weakness.
- Break below 21-EMA to see dip till 23.6% Fib at 0.9035. Further weakness will see test of 200-DMA at 0.89.
- Indicators are slowly turning, decisive close above 5-DMA could see resumption of upside. Scope then for test of 0.9250 (Dec 19 high)
Support levels - 0.91 (21-EMA), 0.9035 (23.6% Fib), 0.89 (200-DMA)
Resistance levels - 0.9150 (5-DMA), 0.92, 0.9238 (Upper BB), 0.9250 (Dec 19 high)
For details on FxWirePro's Currency Strength Index, visit http://www.fxwirepro.com/currencyindex.


