


 AUDJPY Bears Take a Breather at 111.50, But ‘Sell on Rallies’ Still Eyes 110
  FxWirePro: USD/ZAR remains buoyant, looks to extend gains
  Urban studies: Doing research when every city is different
  BTC Slips Below $60K as Institutional Demand Dries Up — Bears Eye $59K Support, Rallies to $63K for Shorts
  Bank of America Posts Strong Q4 2024 Results, Shares Rise
  FxWirePro- Woodies pivot (Major)
  Sterling Slump Sends GBPJPY Toward 212.60 — Bearish EMA Stack Eyes 210
  Bitcoin Sheds $491M in ETF Outflows and Retreats Below $64K; Sellers Reload for $50K
  NZDJPY: The Kiwi Yen's Bull Run Hits a Brick Wall at 92 — Sell the Rally?
  US Gas Market Poised for Supercycle: Bernstein Analysts
  Moody's Upgrades Argentina's Credit Rating Amid Economic Reforms
  FxWirePro: AUD/USD eases after Australian mixed CPI data
  FxWirePro- Major Crypto levels and bias summary
  EURJPY Bounce Loses Steam Below 184 — Sell-the-Rally Setup Eyes 183 Target
  Global Markets React to Strong U.S. Jobs Data and Rising Yields
  US Futures Rise as Investors Eye Earnings, Inflation Data, and Wildfire Impacts
  Oil Prices Dip Slightly Amid Focus on Russian Sanctions and U.S. Inflation Data


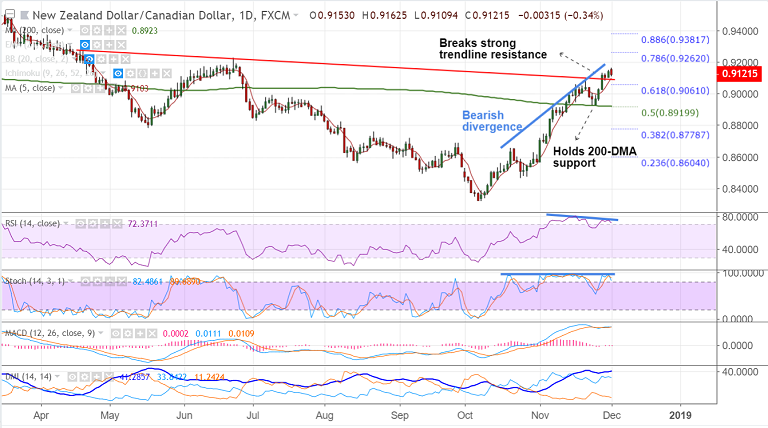
NZD/CAD chart on Trading View used for analysis
- NZD/CAD has slipped lower from fresh 5-month highs at 0.9162.
- The pair is currently trading at 0.9118, down 0.23% on the day.
- Price action has broken above 61.8% Fib and strong trendline resistance at 0.9095.
- Technical indicators are showing some exhaution at overbought levels.
- We also evidence bearish divergence on RSI and Stochs which raises scope for downside.
- However, we do not see any major signs of reversal. 5-DMA is immediate support at 0.9102.
- Retrace below 61.8% Fib could see dip till 200-DMA at 0.8923. Violation at 200-DMA will see bearish continuation.
- On the flipside, price action capped at upper Bollinger Band at 0.9163. Break above weekly cloud at 0.9180 could see test of 78.6% Fib at 0.9262.
For details on FxWirePro's Currency Strength Index, visit http://www.fxwirepro.com/currencyindex.


