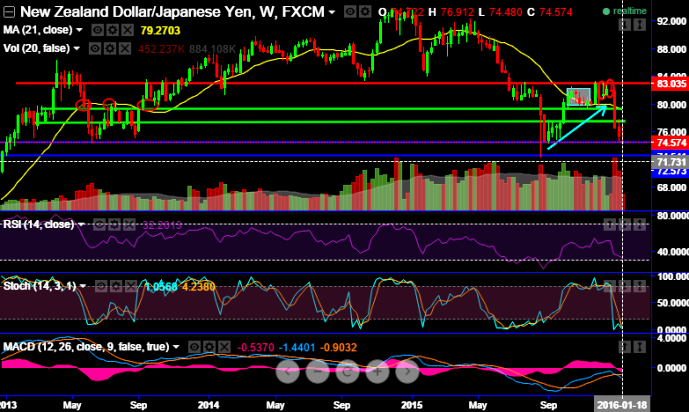
The pair tumbled from 82.868 to 74.541 where it is testing support, if it does not manage to sustain these levels then we surely see next immediate supports at 72.573 but for now it is struggling to hold onto this support level.
As shown on the daily charts, the RSI oscillator has been convincingly converging these price slumps at oversold zones.
Subsequently, %D crossover even below 20's intensifies bears interests in the market, as a result we've seen bears could not resist today's highs of 76.912 and pushing vigorously to the current levels at 74.541. This would mean that selling pressures are piling up.
More importantly, the formation of bearish patterns like shooting star and doji candles at 81.462 and 82.031 levels respectively evidenced weakness already in previous rallies, looks like bulls have completely exhausted and given up.
With current price slipping below 10DMA which is again one more bearish indication. However, today's closing basis should be closely monitored for next trade direction.
Hence, if current price does not manage to hold onto this level we could certainly see more slumps, keeping that point in mind it is advisable to short rallies for targets at 72.573. Even if it shows any abrupt upswings no need to panic, instead use them better entry points for fresh short build ups but medium term it has to drop back.