
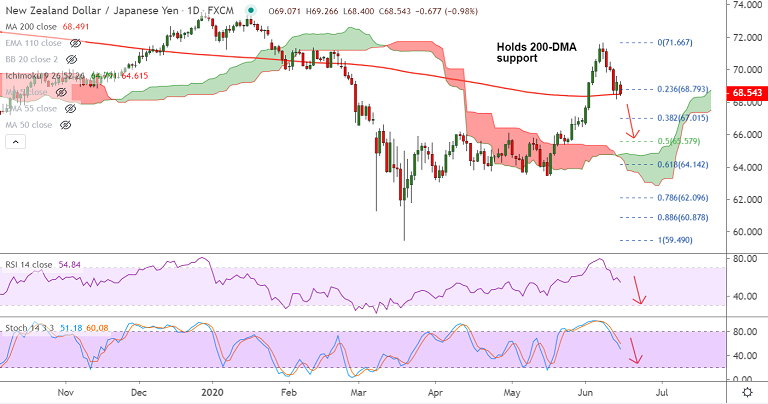
NZD/JPY chart - Trading View
NZD/JPY was trading 1.03% lower on the day at 68.51 at around 06:30 GMT, bias is strongly bearish.
The pair is extending weakness for the 2nd straight week after rejection at 110W EMA.
Price action is currently holding support at 200-DMA at 68.49. Break below will accelerate downside.
Technical indicators support further downside in the pair. Stochs and RSI have rolled over from overbought levels and are biased lower.
MACD is showing a bearish crossover on signal line and Chikou Span in the Inchimoku cloud is sharply lower.
Break below 200-DMA will see drag till 50% Fib retracement at 65.14. Further weakness will see test of cloud support (currently at 64.79).
Major Support - 68.49 (200-DMA)
Major Resistance - 71.39 (110W EMA)
Guidance: Good to go short on break below 200-DMA, SL: 69.35, TP: 67.00/ 65.65/ 64.80


