
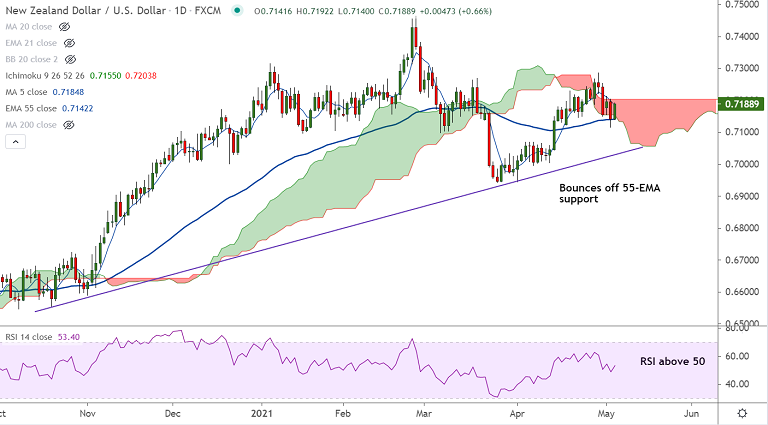
NZD/USD chart - Trading View
Technical Analysis: Bias neutral
GMMA Indicator
- Major and minor trend are neutral on the daily charts
- Weekly charts show major trend is strongly bullish, while minor tend is turning bullish
Ichimoku Analysis
- Price action is within the daily cloud and capped between Tenken and Kijun Sen
- Chikou span is biased higher, keeping scope for upside
Oscillators
- Oscillators are in neutral territory but do not support upside on the daily charts
- Momentum is bullish on the weekly charts
Bollinger Bands
- Volatility is high as evidenced by wide Bollinger bands
Major Support and Resistance Levels:
Support Levels - 0.7161 (21-EMA), 0.7142 (55-EMA), 0.7085 (110-EMA)
Resistance Levels - 0.7203 (Cloud top), 0.7286 (Apr 29 high), 0.73
Summary: NZD/USD trades with a neutral bias on the daily charts, but major trend remains bullish. Price action has bounced off 55-EMA support, raising scope for upside. Watch out for break above daily cloud for upside resumption. US ADP employment and PMI data could offer near-term direction to the pair.


