
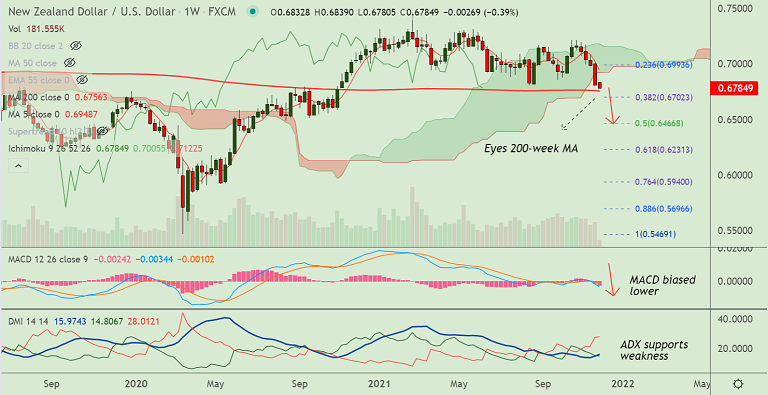
Chart - Courtesy Trading View
Technical Analysis: Bias Bearish
GMMA Indicator
- Shows strong bearish bias on near and long term moving averages on daily and intraday charts
Ichimoku Analysis
- Price action well below the daily cloud, Chikou span is biased lower
- The pair is consolidating break below the weekly cloud
Oscillators
- Stochs and RSI show strong bearish momentum
- Oscillators are at oversold, but no signs of reversal seen
Bollinger Bands
- Bollinger bands are spread wide apart and are showing signs of further widening
- Volatility is hence high and rising, likely to add fuel to the downside momentum
Major Support Levels: 0.6756 (200-week MA), 0.6702 (38.2% Fib)
Major Resistance Levels: 0.6835 (5-DMA), 0.6915 (200H MA)
Summary: NZD/USD trades with a strong bearish bias. After a brief pause on Monday's trade, the pair is set to extend downside. The major is on track to test 200-week MA at 0.6756.


