


 JPY Action Bias: Bullish Pairs to Watch Out For
  FxWirePro: USD/CAD positions for another climb, eyes 1.4150 level
  FxWirePro: GBP/AUD under pressure as pound continues to weaken
  FxWirePro: EUR/AUD outlook weaker on renewed downside pressure
  Major Pair Action Bias: Bullish Pairs to Watch Out For
  NZDJPY Action Bias: Bullish Dip-Buying Opportunity on Broad Yen Weakness
  FxWirePro: USD/CNY dips as yuan firms on improving risk appetite
  AUDJPY Action Bias: Bullish Dip-Buy Setup Despite Flat Neutral Bias
  FxWirePro: GBP/NZD downside pressure builds, key support levels in focus
  FxWirePro: USD/CAD gaining momentum for a move towards 1.4200 level
  FxWirePro- Major Pair levels and bias summary
  FxWirePro- Major Pair levels and bias summary
  FxWirePro: AUD/USD dips after RBA Governor speech
  FxWirePro :USD/JPY eases slightly, remains on bullish path
  FxWirePro- Woodies pivot (Major)
  NZDJPY Pullback: Sell Rallies Toward 93.30 as Yen Weakness Eases


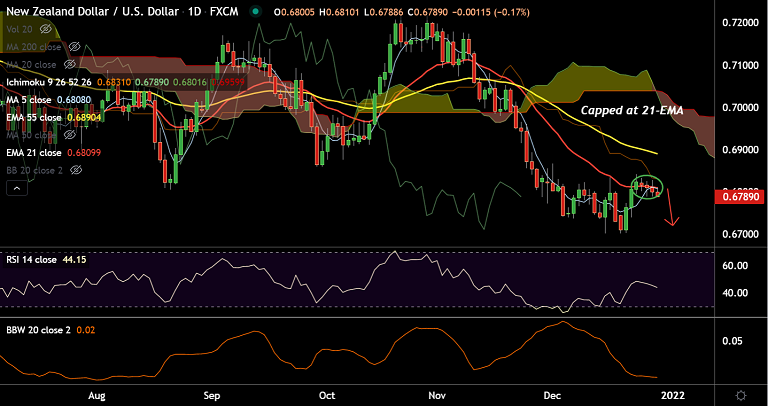
Chart - Courtesy Trading View
Technical Analysis: Bias Bearish
GMMA Indicator
- Major trend is bearish, while minor trend is turning bearish
Ichimoku Analysis
- Price action is below cloud and Chikou span is biased lower
Oscillators
- Stochs and RSI show bearish momentum is gaining strength
- Stochs are on verge of bearish rollover from overbought zone
- RSI is below 50 mark and is turning South
Bollinger Bands
- Bollinger bands are narrow and constricted
Major Support Levels: 0.6780 (20-DMA), 0.6745 (200-week MA), 0.6675 (Lower W BB)
Major Resistance Levels: 0.6809 (21-EMA), 0.6842 (Upper BB), 0.6890 (55-EMA)
Summary: NZD/USD was trading with a bearish technical bias. Failure of bulls to take price above 21-EMA has reinforced bearish bias. Resumption on weakness likely below 20-DMA. Scope for test of 200-week MA at 0.6745.


