


 FxWirePro: GBP/NZD downside pressure builds, key support levels in focus
  FxWirePro- Major Crypto levels and bias summary
  JPY Action Bias: USDJPY, EURJPY, and CADJPY Emerge as Top Extremely Bullish Picks
  FxWirePro: GBP/AUD bears maintain upper hand
  Major Pair Action Bias: Bullish Pairs to Watch Out For
  FxWirePro: GBP/USD downtrend loses steam but outlook still bearish
  FxWirePro: NZD/USD gains as U.S.-Iran peace hopes boost risk sentiment
  JPY Action Bias: Bullish Pairs to Watch Out For
  FxWirePro: EUR/AUD neutral in the near term, scope for downward resumption
  FxWirePro :USD/JPY eases slightly, remains on bullish path
  AUDJPY Extends Four-Day Rally on Yen Weakness: Bullish Dip-Buy Eyes 117-118
  FxWirePro: GBP/AUD under pressure as pound continues to weaken
  Major Pairs Action Bias: USDCHF Emerges Extremely Bullish as EURUSD and GBPUSD Turn Deeply Bearish
  BTC, ETH, SOL, XRP, and BNB: Major Crypto Pairs Stay Neutral
  FxWirePro: USD/CAD positions for another climb, eyes 1.4150 level
  FxWirePro- Major Pair levels and bias summary


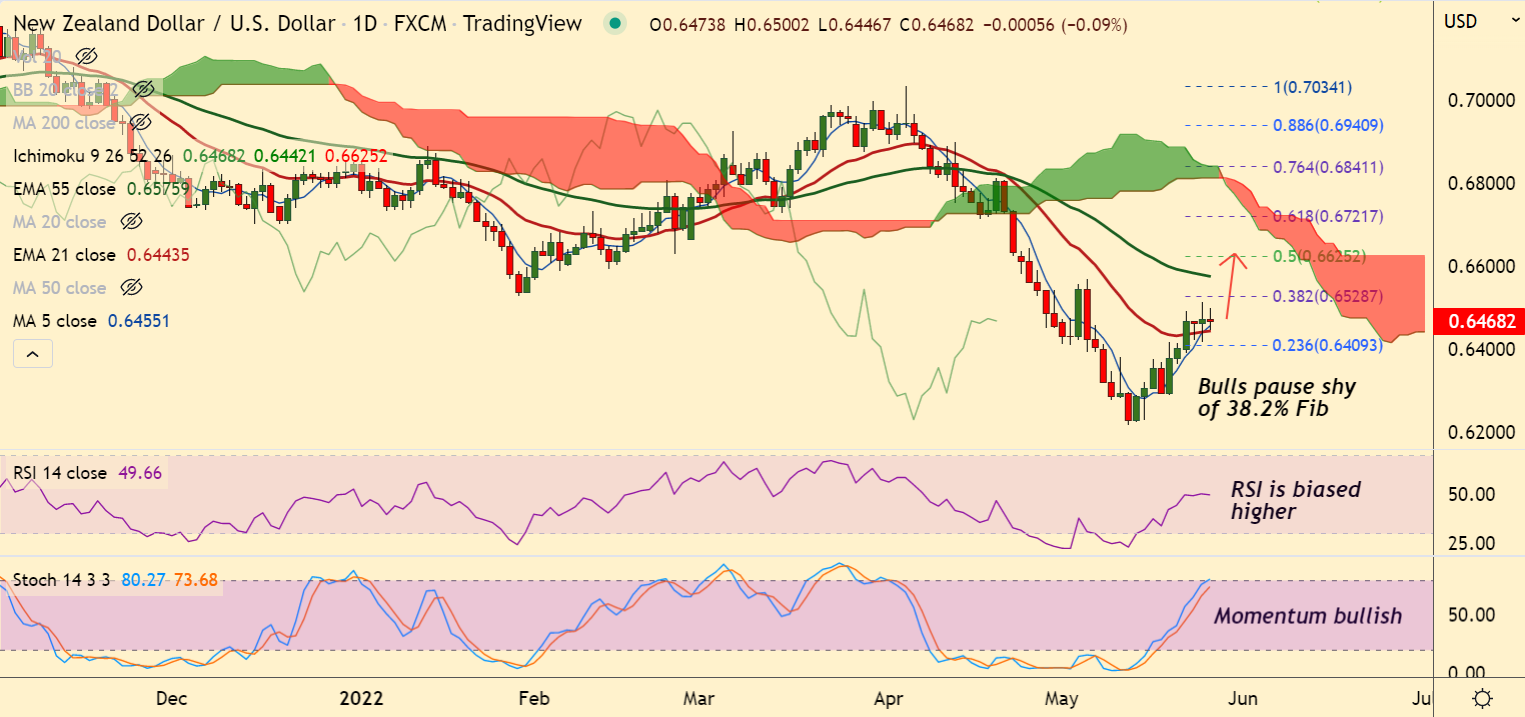
Chart - Courtesy Trading View
Spot Analysis:
NZD/USD was trading 0.05% lower on the day at 0.6470 at around 09:25 GMT
Previous Week's High/ Low: 0.6417/ 0.6228
Previous Session's High/ Low: 0.6514/ 0.6417
Fundamental Overview:
RBNZ’s warning signal for a potential recession has dampened the antipodean.
NZD/USD pauses shy of 38.2% Fib as risk-off impulse rebounds ahead of US PCE.
Focus now on US Gross Domestic Product (GDP) and Personal Consumption Expenditure (PCE) numbers for impetus.
Analysts expect US GDP to stay unchanged at -1.4% on annual basis. US PCE is also expected to remain stable at 7%.
Technical Analysis:
- Spinning top and Doji formations on the daily candle dent upside in the pair
- Price action is extending gains for the second straight week
- The pair is grinding sideways at 21-EMA support
- GMMA indicator shows minor trend has turned bullish
Major Support and Resistance Levels:
Support - 0.6443 (21-EMA), Resistance - 0.6576 (55-EMA)
Summary: NZD/USD consolidates above 21-EMA support, weakness only on break below. Momentum is bullish, scope for test of 38.2% Fib at 0.6528.


