
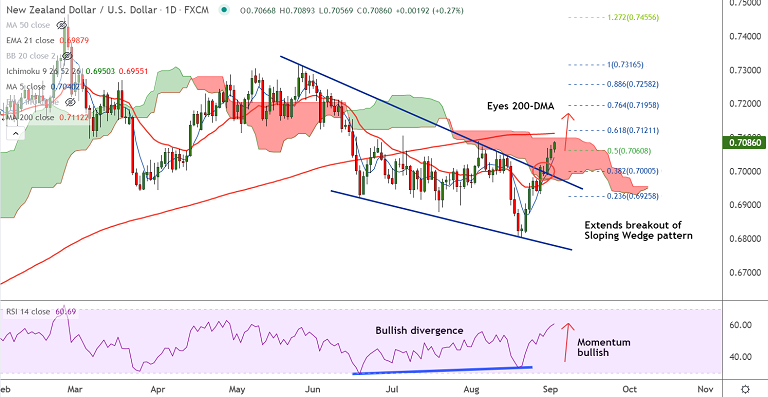
NZD/USD chart - Trading View
NZD/USD was trading 0.35% higher on the day at 0.7091 at around 10:05 GMT, outlook bullish.
The pair is extending gains for the 4th straight session, is on track to test 200-DMA at 0.7112.
DXY trades weak after poor ADP data on Wednesday, adding upside support to the pair.
Investors now await U.S. August non-farm payrolls data due tomorrow which could give more clarity on the U.S. Federal Reserve's timeline on tapering of asset purchases.
Technical bias for the pair is bullish. MACD and ADX support gains. Momentum indicators are bullish.
GMMA indicator shows near-term trend is bullish, while major trend is turning bullish. A bullish RSI divergence adds to the upside bias.
The pair is on track to test 200-DMA at 0.7112. Decisive break above will propel the pair higher.


