


 US Magnificent 7 Stocks Trend Score: Amazon & Microsoft Hit Extreme Bullish (+100) as Meta Drops to -100 — Key Resistance & Support Watchlist
  FxWirePro- Woodies pivot (Major)
  FxWirePro: GBP/USD rises as soft US data pressures dollar
  FxWirePro: GBP/NZD remains weak, eyes 38.2%fib support
  AUD/JPY Slips Below 112 as BOJ Intervention Sparks Bearish Momentum: Sell the Rallies
  FxWirePro- Woodies pivot (Major)
  AUDJPY Volatile After Massive Sell-Off: Sell Rallies at 113, Targeting 110 as Bearish Momentum Surges
  FxWirePro: GBP/NZD remains weak, eyes 38.2%fib support
  FxWirePro: USD/CAD retreats after Canada posts stronger-than-expected GDP growth
  FxWirePro- Major Pair levels and bias summary
  NZDJPY Retreats on Yen Strength – Bearish Setup Targets 90 After Hitting 92.75 Low
  NZDJPY Bullish Rebound: Buy Dips as EMAs Align for 97 Target
  Nikkei Surges Past 65,000 on Suspected Yen Weakness: Tech Giants Like Advantest and NEC Lead Explosive Gains
  FxWirePro: USD/ZAR gains as stronger dollar outweighs upbeat South Africa's trade surplus
  FxWirePro: NZD/USD consolidates overnight gains, but loses momentum
  FxWirePro: AUD/USD gains some ground but outlook is bearish


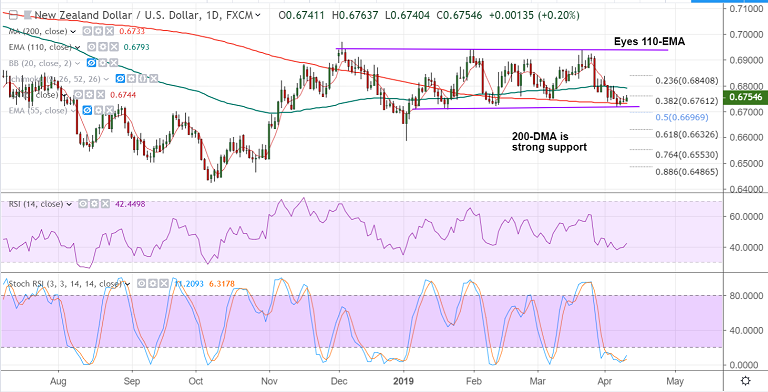
NZD/USD chart - Trading View
- NZD/USD extends gains after bouncing off 200-DMA support.
- The pair is trading 0.26% higher on the day at 0.6758 at 1025 GMT.
- Price is holding above 5-DMA and is hovering around 38.2% Fib.
- RSI has turned and Stochs are at oversold levels with scope for minor pullbacks.
- Upside finds strong resistance at 1H 200-SMA at 0.6769. Break above will likely see gains upto 110-EMA at 0.6793.
- On the flipside, weakness to resume on decisive break below 200-DMA.
- Focus now on US inflation data and FOMC minutes for further impetus.
Support levels - 0.6744 (5-DMA), 0.6733 (200-DMA), 0.67
Resistance levels - 0.6769 (1H 200-SMA), 0.6793 (110-EMA), 0.68
For details on FxWirePro's Currency Strength Index, visit http://www.fxwirepro.com/currencyindex.


