


 FxWirePro: AUD/USD dips after RBA Governor speech
  Major Pairs Action Bias: USDCAD and USDCHF Stand Out as Extremely Bullish While GBPUSD and NZDUSD Turn Extremely Bearish
  FxWirePro: EUR/AUD outlook weaker on renewed downside pressure
  FxWirePro- Woodies pivot (Major)
  FxWirePro: USD/ZAR uptrend loses steam, remains on bullish path
  FxWirePro: USD/CAD gaining momentum for a move towards 1.4200 level
  EUR/USD Bounces from Monthly Low, But Bearish Pressure Remains
  JPY Action Bias: USDJPY Emerges as the Clear Bullish Pair to Watch Amid Mixed Crosses
  AUDJPY Action Bias: Bullish Dip-Buy Setup Despite Flat Neutral Bias
  FxWirePro: NZD/USD edges lower, remains on back foot
  FxWirePro: GBP/NZD gains some ground but bias is still bearish
  FxWirePro: EUR/NZD up trend gains momentum but hurdles ahead
  FxWirePro- Major Pair levels and bias summary
  FxWirePro: USD/CAD runs out of steam but maintains bullish outlook
  NZDJPY Pullback: Sell Rallies Toward 93.30 as Yen Weakness Eases
  GBPJPY Slips After Sterling Weakness, Bears Eye 216


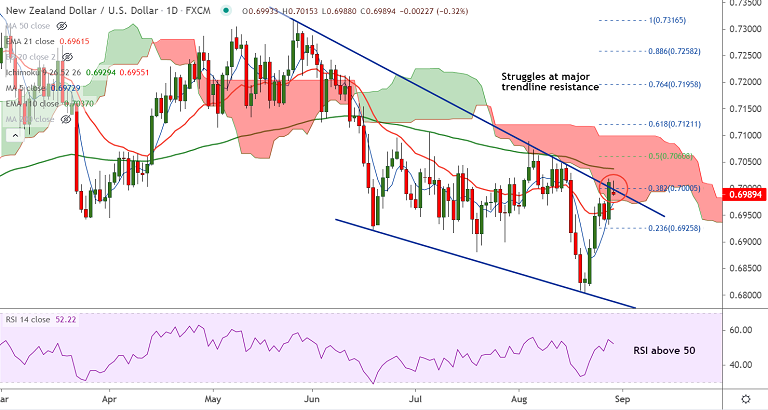
NZD/USD chart - Trading View
Technical Analysis: Bias Turning Bullish
- NZD/USD was trading around 0.70 handle at around 10:40 GMT
- The pair is attempting breakout of Sloping Wedge pattern
- Bullish 5-DMA crossover on 20-DMA adds to the upside bias
- Momentum indicators have turned bullish and volatility is high
- Bullish MACD line crossover on signal line supports bullishness
- Bullish divergence on RSI from price action on the daily charts aids bulls
Support levels - 0.6975 (5-DMA), 0.6962 (21-EMA), 0.6925 (23.6% Fib)
Resistance levels - 0.7037 (110-EMA), 0.7060 (50% Fib), 0.7110 (200-DMA)
Summary: NZD/USD is extending downside in a Slopping Wedge pattern. Major bias is bearish, but near-term trend shows some signs of upside. Price action is pivotal at 38.2% Fib and Wedge top resistance at 0.70. Decisive breakout of Sloping Wedge pattern will buoy bulls in the pair.
Focus on US Pending Home Sales for July and Dallas Fed Manufacturing Business Index for August due later in the NY session for trading opportunities. Next major resistance lies at 50% Fib at 0.7060.


