


 FxWirePro: GBP/NZD remains weak, eyes 38.2%fib support
  FxWirePro:USD/JPY climbs back above 160.00 after BOJ rate decision
  FxWirePro- Woodies pivot (Major)
  FxWirePro- Major Crypto levels and bias summary
  FxWirePro: USD/CAD retreats after Canada posts stronger-than-expected GDP growth
  FxWirePro: USD/JPY dips as market assess risk of additional FX intervention.
  FxWirePro: GBP/AUD drifts lower after BOE rate decision
  FxWirePro: AUD/USD gains some ground but outlook is bearish
  FxWirePro- Major Crypto levels and bias summary
  FxWirePro: GBP/AUD bears maintain upper hand
  Major European Indices Score Extremely Bullish: DAX Eyes 26000, CAC Targets 8600, FTSE100 at 11000 – Key Levels to Watch
  US Magnificent 7 Stocks Trend Score: Amazon & Microsoft Hit Extreme Bullish (+100) as Meta Drops to -100 — Key Resistance & Support Watchlist
  FxWirePro: USD/ZAR gains as stronger dollar outweighs upbeat South Africa's trade surplus
  JPY Currency Meter Signals: NZDJPY Bullish (+25) vs CHFJPY (-100) – These Pairs Could Move Next
  US Magnificent 7 Stocks Trend Score: Amazon & Microsoft Hit Extreme Bullish (+100) as Meta Drops to -100 — Key Resistance & Support Watchlist
  AUDJPY Volatile After Massive Sell-Off: Sell Rallies at 113, Targeting 110 as Bearish Momentum Surges


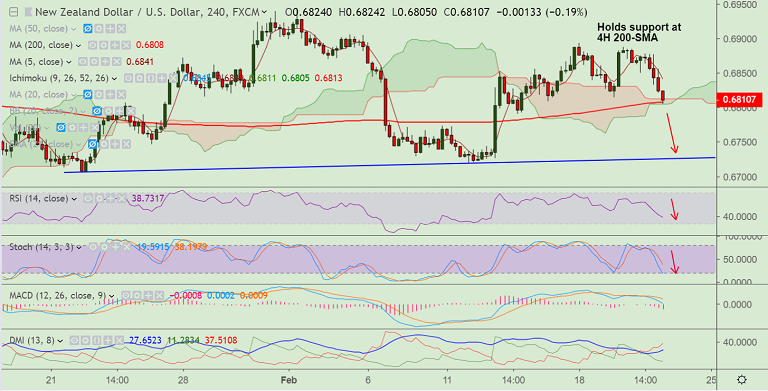
NZD/USD chart on Trading View used for analysis
- NZD/USD has halted downside at 4H 200-SMA support at 0.68 level.
- The pair is edging lower as the kiwi is tracking weakness in the Australian dollar.
- The antipodeans await clues from the two-day Washington visit by China’s Vice Premier Liu He.
- With no major data scheduled from New Zealand during Thursday, focus shall be on the US-China trade talks.
- Technical indicators on the intraday charts have turned bearish. Scope for weakness till 200-DMA at 0.6752.
- 5-DMA has turned and is immediate resistance at 0.6854. Break above negates bearish bias.
Support levels - 0.6808 (4H 200-SMA), 0.6776 (110-EMA), 0.6752 (200-DMA)
Resistance levels - 0.6830 (20-DMA), 0.6853 (5-DMA), 0.6893 (Feb 18 high)
Recommendation: Stay short below 0.68, SL: 0.6830, TP: 0.6775/ 0.6755
For details on FxWirePro's Currency Strength Index, visit http://www.fxwirepro.com/currencyindex.


