


 China’s Growth Faces Structural Challenges Amid Doubts Over Data
  FxWirePro: USD/JPY dips as market assess risk of additional FX intervention.
  JPY Currency Meter Signals: NZDJPY Bullish (+25) vs CHFJPY (-100) – These Pairs Could Move Next
  Forex Scorecard: EUR/USD, GBP/USD, and NZD/USD Stand Out as Prime Bullish Opportunities
  Moldova Criticizes Russia Amid Transdniestria Energy Crisis
  FxWirePro:USD/JPY climbs back above 160.00 after BOJ rate decision
  FxWirePro: NZD/USD consolidates overnight gains, but loses momentum
  FxWirePro: AUD/USD cedes early gains ,outlook bearish
  Fed May Resume Rate Hikes: BofA Analysts Outline Key Scenarios
  Geopolitical Shocks That Could Reshape Financial Markets in 2025
  S&P 500 Relies on Tech for Growth in Q4 2024, Says Barclays
  FxWirePro: GBP/AUD bears maintain upper hand
  FxWirePro: USD/CNY downtrend loses steam, remains on bearish path
  FxWirePro- Woodies pivot (Major)
  U.S. Stocks vs. Bonds: Are Diverging Valuations Signaling a Shift?
  FxWirePro: GBP/AUD drifts lower after BOE rate decision


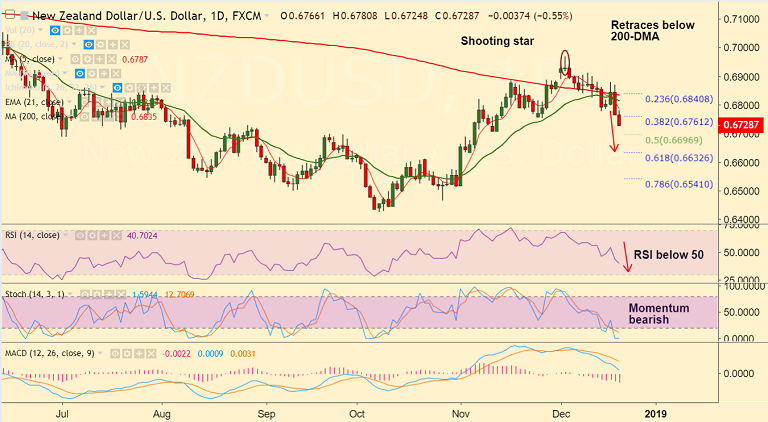
NZD/USD chart on Trading View used for analysis
- NZD/USD retraces break above 200-DMA slumps lower overnight on hawkish Fed hike.
- The pair is extending weakness today after New Zealand Q3 GDP missed forecasts, hits 5-week lows at 0.6724.
- Data released earlier today showed New Zealand Q3 GDP arrived at +0.3% q/q vs the 0.6% expected and 1.0% in Q2.
- For the y/y, GDP was up 2.6% missing forecasts at 2.8% compared to 3.2% prior, revised up from 2.8%.
- Antipodean currencies further under pressure amid risk-off market profile.
- Technical indicators have shown a sharp switch in trajectory. RSI and Stochs are sharply lower.
- The pair has broken below 38.2% Fib and is now on track to test next major support at 0.67.
Support levels - 0.67, 0.6632 (61.8% Fib), 0.6598 (Sept 28 low)
Resistance levels - 0.6761 (38.2% Fib), 0.6787 (5-DMA), 0.6815 (21-EMA)
Recommendation: Good to go short on upticks, SL: 0.6790, TP: 0.67/ 0.6635
For details on FxWirePro's Currency Strength Index, visit http://www.fxwirepro.com/currencyindex.


