


 FxWirePro: AUD/ USD strongly bearish despite upside attempts
  FxWirePro: GBP/USD weakens as escalating Middle East tensions weighs on sterling
  FxWirePro- Major Pair levels and bias summary
  Relief Rally Extends to 112.75, but AUDJPY EMA Structure Favors Selling
  FxWirePro: GBP/AUD gaining momentum for a move towards 1.9150 level
  FxWirePro: NZD/USD softens as US intensifies attacks on Iran
  FxWirePro- Major European Indices
  CAD/JPY Breaks Down: Loonie Weakness and BOC Patience Set Bears’ Sights on 110
  FxWirePro: USD/JPY consolidates gains amid Middle East tensions and policy uncertainty
  FxWirePro- Major Crypto levels and bias summary
  FxWirePro- Woodies pivot (Major)
  ECB Hikes, Euro Dives: EURUSD Bears Reload for a Run to 1.1400
  NZDJPY Bears Take the Wheel: Sell-the-Rally Setup Targets 90.50 as Kiwi Cracks
  AUDJPY Sinks for Third Straight Day as Bears Eye 110.50
  FxWirePro- Woodies pivot (Major)
  FxWirePro: USD/ CNY falls towards 6.750, bears keep the advantage
  Sell the Bounce: NZDJPY Bearish Bias Persists Below 94.20, Eyes 90.50


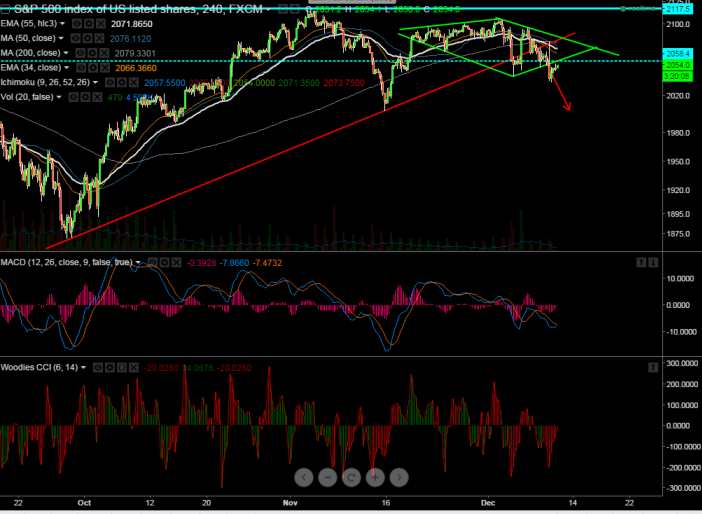
- Pattern formed -Diamond Formation
- Major intraday resistance - 2085 (trend line joining 2106 and 2096)
- S&P 500 has broken major support (diamond formation) level around 2050 and declined till 2035. The index has recovered till 2079 and it is currently trading around 2050. Short term trend is still weak as long as resistance 2085 holds.
- Any break below diamond formation confirms minor weakness, a decline till 2020/2000 is possible .
- On the higher side any break above 2085 will take the index till 2096/2106 level.
It is good to sell on rallies around 2060-65 with SL around 2085 for the TP of 2025/2003


