


 FxWirePro- Woodies Pivot(Major)
  FxWirePro- Major European Indices
  FxWirePro: GBP/AUD gains some upside momentum but still bearish
  FxWirePro: GBP/NZD down trend loses steam, remains on bearish path
  Bitcoin’s Volatile Reset: ETFs Rebound as Bulls Eye USD 80,000 Milestone
  FxWirePro: EUR/AUD downtrend loses steam but outlook still bearish
  Euro Holds the Line: EURUSD Finds Support at the 365-EMA as Peace Talks Loom
  FxWirePro: USD/CNY neutral in the near-term, scope for downward resumption
  FxWirePro:NZD/USD uptrend loses momentum but bullish setup remains
  FxWirePro: GBP/USD biased higher but rally currently stretched
  FxWirePro: GBP/USD bulls remain cautiously optimistic
  FxWirePro- Major Pair levels and bias summary
  NZDJPY Bulls Charge Toward 95.00: Safe-Haven Exodus Drives Kiwi Rally
  FxWirePro: EUR/CAD gains ground on prospects of resumed energy flows
  Energy Surge Ignites US Inflation: USDCHF Eyes Support Amid Dollar Sell-Off
  FxWirePro: USD/CAD recovers slightly but bearish outlook persists


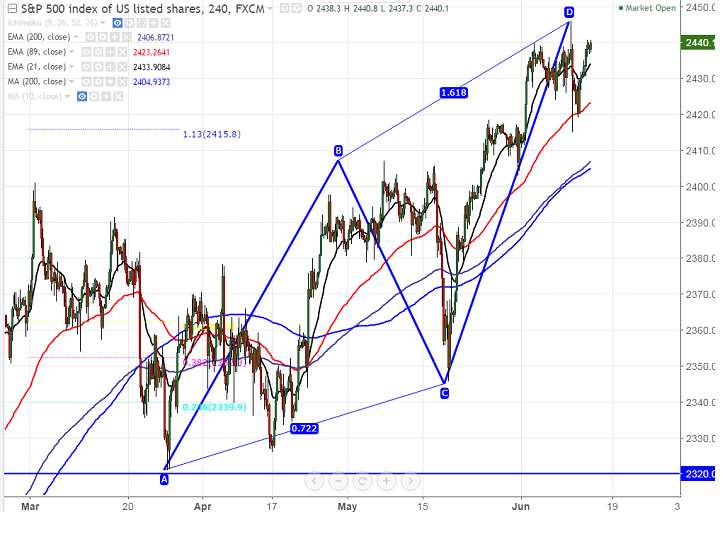
- Harmonic pattern – Bearish AB=CD pattern.
- Potential Reversal Zone (PRZ) – 2445.
- S&P500 is consolidating in narrow range between 2445 and 2404 for the past ten trading session. It is currently trading around 2440.
- In the daily chart the index has formed potential Bearish AB=CD pattern and got completed at 2445.Any break above potential reversal zone will take the S&P500 till 2457 (161.8% retracement of 2401 and 2321).
- On the lower side, major support is around 2396 (daily Kijun-Sen) and any break below will drag the index till 2367 (89 EMA)/2345 (May 18th 2017 low).
It is good to sell on rallies around 2440-2445 with SL around 2457 for the TP of 2390/2359.


