


 FxWirePro: USD/JPY holding bid into weekend
  FxWirePro: GBP/AUD gains some upside momentum but still bearish
  NZDJPY Bulls Charge Toward 95.00: Safe-Haven Exodus Drives Kiwi Rally
  FxWirePro: GBP/NZD down trend loses steam, remains on bearish path
  FxWirePro:NZD/USD uptrend loses momentum but bullish setup remains
  Ethereum Consolidates: Bullish Technicals Point to a Potential $3,000 Breakout
  FxWirePro: GBP/USD bulls remain cautiously optimistic
  FxWirePro- Major Pair levels and bias summary
  Euro Holds the Line: EURUSD Finds Support at the 365-EMA as Peace Talks Loom
  FxWirePro: USD/CNY neutral in the near-term, scope for downward resumption
  FxWirePro: USD/ZAR recovers slightly but trend is still bearish
  FxWirePro- Major Pair levels and bias summary
  FxWirePro: GBP/AUD positions for another drop, eyes 1.8900level
  FxWirePro- Woodies Pivot(Major)
  FxWirePro: USD/CAD recovers slightly but bearish outlook persists
  FxWirePro- Major Crypto levels and bias summary


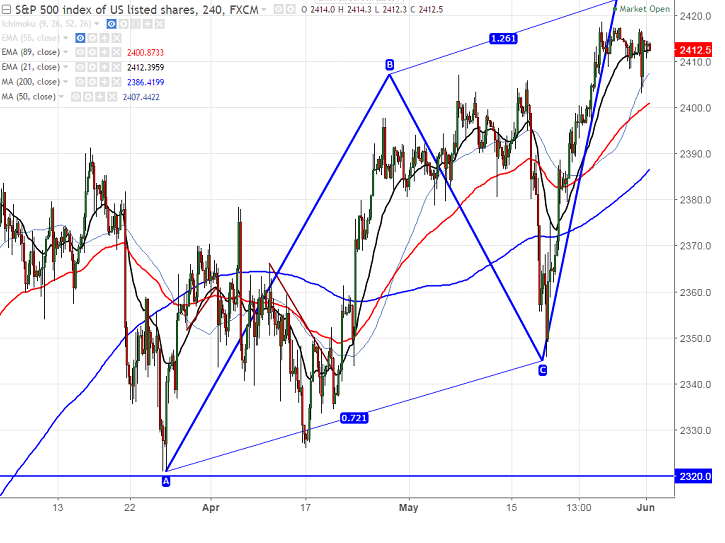
- Harmonic pattern – Bearish AB=CD pattern
- Potential Reversal Zone (PRZ) – 2425.
- S&P500 is consolidating around 2400 for the past five trading session. The index hits the all-time high of 2418 on 25th May 2017 and is trading around narrow range between 2418 and 2402. It is currently trading around 2413.
- In the daily chart the index has formed potential Bearish AB=CD pattern and is expected to get completed at 2425.Any break above potential reversal zone will take the S&P500 till 2445 (161.8% retracement of 2407 and 2345).
- On the lower side, major support is around 2400 (89- 4H EMA) and any break below will drag the index till 2385 (200 – 4H MA)/2345 (May 18th 2017 low).
It is good to sell on rallies around 2425 with SL around 2445 for the TP of 2385/2345.


