


 FxWirePro- Major Crypto levels and bias summary
  Bitcoin’s Volatile Reset: ETFs Rebound as Bulls Eye USD 80,000 Milestone
  FxWirePro:NZD/USD uptrend loses momentum but bullish setup remains
  NZDJPY Bulls Charge Toward 95.00: Safe-Haven Exodus Drives Kiwi Rally
  FxWirePro: GBP/USD biased higher but rally currently stretched
  FxWirePro: USD/ZAR recovers slightly but trend is still bearish
  FxWirePro: AUD/USD retreats slightly but trend is still bullish
  FxWirePro- Major Pair levels and bias summary
  FxWirePro: USD/CAD extends decline on broad dollar weakness
  FxWirePro- Woodies Pivot(Major)
  FxWirePro: USD/CAD recovers slightly but bearish outlook persists
  FxWirePro: USD/CNY neutral in the near-term, scope for downward resumption
  FxWirePro- Major Pair levels and bias summary
  FxWirePro: GBP/AUD gains some upside momentum but still bearish
  FxWirePro- Woodies Pivot(Major)
  FxWirePro: EUR/AUD downtrend loses steam but outlook still bearish


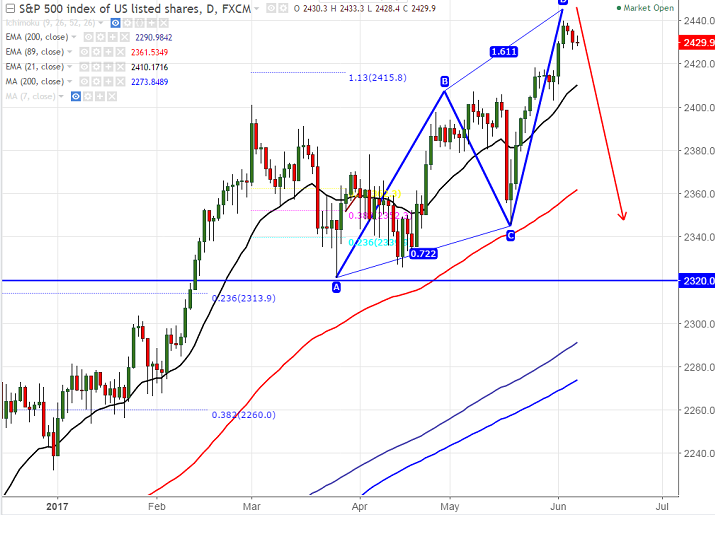
- Harmonic pattern – Bearish AB=CD pattern
- Potential Reversal Zone (PRZ) – 2445.
- S&P500 winning streak is on hold after hitting high of 2440 on Jun 2nd 2017 and is consolidating around 2425 and 2440 for the past two trading session. It is currently trading around 2430.
- In the daily chart the index has formed potential Bearish AB=CD pattern and is expected to get completed at 2445.Any break above potential reversal zone will take the S&P500 till 2457 (161.8% retracement of 2401 and 2321).
- On the lower side, major support is around 2392 (daily Kijun-Sen) and any break below will drag the index till 2359 (89 EMA)/2345 (May 18th 2017 low).
It is good to sell on rallies around 2440-2445 with SL around 2457 for the TP of 2390/2359.


