


 FxWirePro- Major Pair levels and bias summary
  FxWirePro: USD/CNY gains some ground but bearish outlook persists
  FxWirePro: AUD/USD downside pressure builds, key support level in focus
  FxWirePro: USD/CAD runs out of steam but maintains bullish outlook
  FxWirePro- Major Crypto levels and bias summary
  FxWirePro: GBP/USD outlook weaker on renewed downside pressure
  Ethereum Retreats Toward USD 2,000: Technicals Signal Caution as ETH Mimics Bitcoin’s Pullback
  FxWirePro: USD/ZAR fibo rejection triggers sizeable pullback
  FxWirePro- Major Pair levels and bias summary
  Aussie Retreats Against the Yen: AUDJPY Bears Target 108 as 110 Resistance Holds Firm
  FxWirePro: GBP/NZD range to extend until there is game changing news
  Pound Under Pressure as Yen Stabilizes: GBPJPY Bears Target 208 as Key EMAs Hold Resistance
  FxWirePro: GBP/NZD remains buoyant, looks to extend gains
  FxWirePro: EUR/AUD gaining momentum for a move towards 1.6800 level
  EUR/JPY Bulls Charge: Eyeing 186.00 as Euro Strength Intensifies


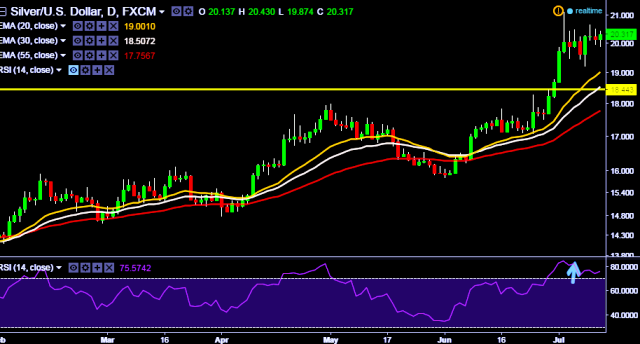
- XAG/USD is currently trading around $20.30 marks.
- It made intraday high at $20.43 and low at $19.87 levels.
- Intraday bias remains bullish till the time pair holds key support at $19.87 marks.
- A daily close above $20.32 tests key resistances at $20.45, $20.66, $20.78, $21.09 and $21.46 marks respectively.
- On the other side, a daily close below $20.05 will take the parity down towards key supports at $19.96, $19.87, $19.65, $19.34, $19.12, $19.09 and $18.68 marks respectively.
- Important to note here that in a daily chart, 20D, 30D and 55D EMA heads up and confirms the bullish trend.
We prefer to take long position in XAG/USD around $20.30, stop loss at $20.05 and target $20.50/$20.65/ $20.78 marks.


