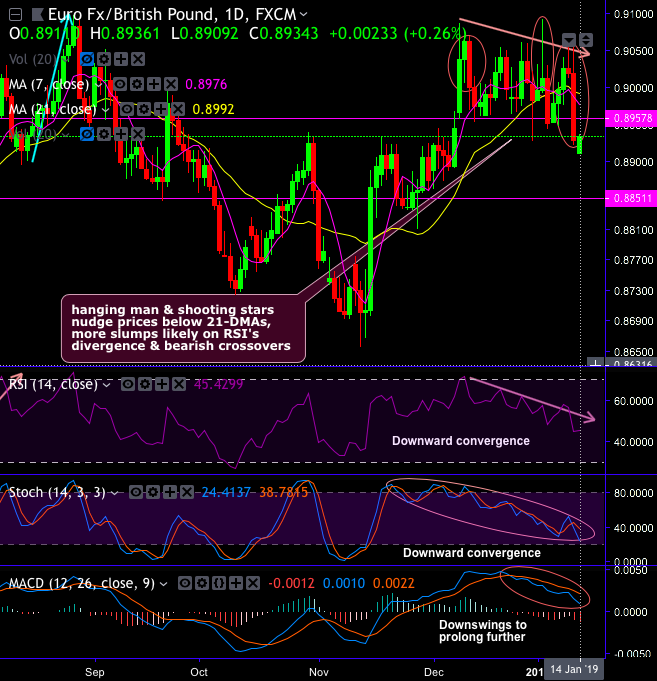
Technical chart and candlestick patterns: On a daily terms, hanging man and shooting star followed by engulfing patterns have been appeared on EURGBP daily plotting.
Hammer has occurred at 0.9062 with engulfing at 0.8999 and shooting star at 0.9012 and 0.9018 with engulfing at 0.8929 levels.
These bearish patterns have nudged the current prices below 21 & 7-DMAs, for now, more slumps seem likely on RSI's divergence and bearish DMA and MACD crossovers.
The end of last month flow saw the EURGBP spike down to re-test range supports in the 0.8950/0.8863 region. While over that region the risks remain for a test above 0.9100. However, for now we seem content to remain within a range. Above 0.9100, next resistance lies around 0.9160, the last main technical barrier ahead of 0.9305 (which traded back in August 2017). Below 0.8877, 0.8788 has been pivot support within the medium-term range. Key support in that process is at 0.8700-0.8620.
Momentum study: RSI divergence indicates overbought pressures but gaining strength at 52 levels. While stochastic curves show downward convergence that indicates intensified bearish momentum.
Trend study: Both lagging indicators (DMA & MACD) show bearish crossovers to indicate downswings to prolong further.
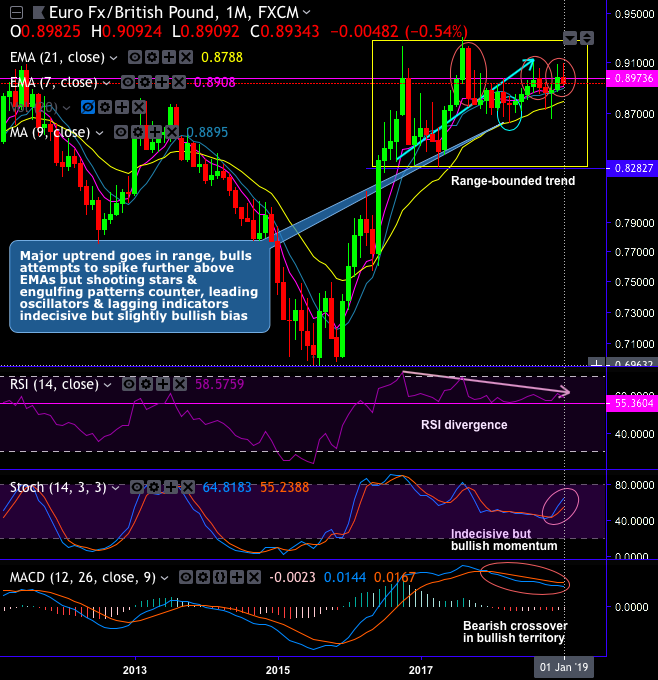
On a broader perspective, The major uptrend now goes in the range, while bulls attempts to spike further above EMAs but shooting stars & engulfing patterns, on this timeframe also, counter (refer monthly chart). While both leading oscillators and lagging indicators indecisive but slightly on bullish bias. The re-test of the 2008 highs at 0.9802 level is not disregarded. Nevertheless, the risk of that has decreased as the medium-term range plays out. A decline through 0.8250 key support would negate upside risks and suggest a move back to 0.8000 and 0.7500.
Trade tips: Contemplating above technical factors, we positioned for a modest albeit distinctly bounded relief rally in GBP ahead of this week’s Brexit vote in the UK parliament through a ratio put spread. Maintain a 2m 1x1.5 EUR put/GBP call spread, 0.88- 0.8650 with an 0.85 RKI on the lower strike. Expiry March 15, 2019. Paid 39bp in November. Marked at 2bp.
Currency Strength Index: FxWirePro's hourly EUR spot index has flashed at -27 (which is bearish), while hourly GBP spot index has shown 142 (highly bullish), while articulating at 06:17 GMT.
For more details on the index, please refer below weblink: http://www.fxwirepro.com/currencyindex