


 NZDJPY Bullish Rebound: Buy Dips as EMAs Align for 97 Target
  FxWirePro: USD/CNY dips to hit three year low,scope for further downside
  FxWirePro: GBP/AUD drifts lower after BOE rate decision
  FxWirePro- Woodies pivot (Major)
  FxWirePro: USD/CAD retreats after Canada posts stronger-than-expected GDP growth
  JPY Currency Meter Signals: NZDJPY Bullish (+25) vs CHFJPY (-100) – These Pairs Could Move Next
  AUDJPY Volatile After Massive Sell-Off: Sell Rallies at 113, Targeting 110 as Bearish Momentum Surges
  FxWirePro: GBP/AUD bears maintain upper hand
  FxWirePro- Woodies pivot (Major)
  FxWirePro- Major Crypto levels and bias summary
  US Magnificent 7 Stocks Trend Score: Amazon & Microsoft Hit Extreme Bullish (+100) as Meta Drops to -100 — Key Resistance & Support Watchlist
  FxWirePro- Major Crypto levels and bias summary
  FxWirePro- Major Pair levels and bias summary
  FxWirePro:USD/JPY climbs back above 160.00 after BOJ rate decision
  FxWirePro: GBP/NZD remains weak, eyes 38.2%fib support


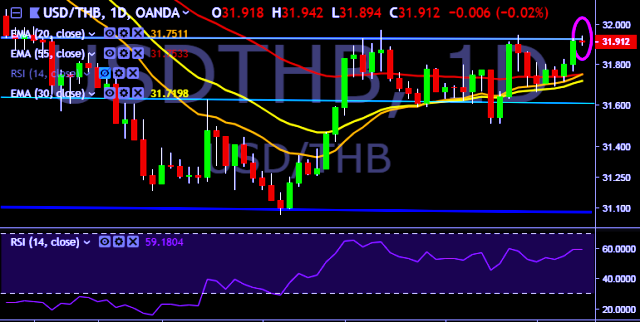
- USD/THB is currently trading around 31.91 marks.
- It made intraday high at 31.94 and low at 31.89 marks.
- Intraday bias remains bullish till the time pair holds key support at 31.70 mark.
- On the top side, key resistances are seen at 31.94, 32.02, 32.10, 32.22 and 32.54 marks respectively.
- Alternatively, a daily close below 31.91 will drag the parity down towards key supports around 31.70, 31.58, 31.42, 31.28, 31.20 and 31.06 marks respectively.
- Important to note here that 20D, 30D and 55D EMA heads down and confirms the bearish trend in a daily chart.
We prefer to take long position on USD/THB around 31.90, stop loss 31.84 and target of 32.02/32.10.


