


 FxWirePro: AUD/USD grinds higher, but topside extension unlikely
  FxWirePro- Major Crypto levels and bias summary
  FxWirePro: USD/CAD edges lower but outlook is still bullish
  EUR/USD Bearish Rebound: Selling the Rallies Near Trendline Resistance
  Major Pair Currency Score & Key Levels to Watch: GBPUSD Extremely Bearish; EURUSD, NZDUSD and AUDUSD Bearish; USDCAD and USDCHF Bullish
  FxWirePro: NZD/USD rebounds modestly but outlook is still bearish
  FxWirePro- Woodies Pivot
  FxWirePro: USD/JPY edges higher, remains on bullish path
  FxWirePro: GBP/NZD uptrend loses momentum but bullish setup remains
  FxWirePro: GBP/USD retreats as Bailey warns of prolonged inflation risks
  Currency Score Update: EURUSD & GBPUSD Bearish, USDCAD Strongest
  FxWirePro: USD/CAD climbs to 18-month peak after sharp Canadian employment decline
  FxWirePro: EUR/AUD bearish momentum builds ,eyes 1.5900 level
  FxWirePro: GBP/NZD positions for another climb, eyes 2.3700 level
  FxWirePro: USD/ZAR uptrend loses steam, remains on bullish path
  JPY Major Currency Score: USD/JPY Bullish, Other Pairs Neutral
  FxWirePro: EUR/AUD gains some ground but outlook is bearish


 Add as a preferred source on Google
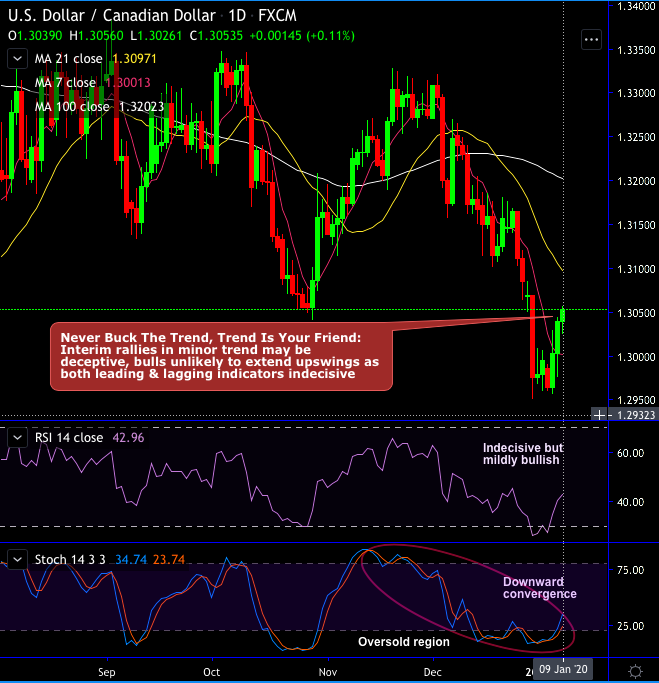
USDCAD closed out 2019 on the defensive and made a crucial weekly/monthly close below long-term support zone of (1.2950 – 1.3165) drawn off the 2015-17 support zone for the USD on the longer run charts.
Although the pair has been attempting show some minor rallies from last 2-3 days, it is unwise to buck the major trend, interim rallies in the minor trend may be deceptive, bulls unlikely to extend upswings as both leading & lagging indicators indecisive.
On a broader perspective, the major uptrend that was through uptrend line so far, ever since the bearish engulfing candle has occurred at 1.3123 level in January’19 (see circular area) the trend appears to be vulnerable.
For now, the bears have managed to breach trend line support to signal weakness as both momentum oscillators indicative of overbought pressures, current price slides below 7&21-EMAs.
We think late 2019 price signals overall are tipping the technical outlook for the USD clearly to the downside.
1) The USD met steady resistance in the mid-1.33s and the break under the H2 range base suggests 300-350bps of downside potential potentially from the 1.3050 or so zone.
2) Q4 overall was bearish for the USD (“engulfing” candle on the quarterly chart.
3) Six weeks of consecutive net losses for the USD have established a strong downtrend on the intraday, daily and weekly oscillators. This provides for a high conviction call for the USD trend lower to extend in the near to medium term and implies to us that scope for counter-trend USD corrections is limited (likely to the low/mid 1.30s).
Therefore, overall we continue to believe that further downward pressure on the USD will emerge as 2020 develops. Key resistance now is 1.3165/70. We target a drop to 1.28 (at least) in the months to come.
At spot reference: 1.3052 levels (while articulating), we recommend directional hedges that comprised of longs in EURUSD futures contracts of January’20 delivery, simultaneously, shorts in futures of March’20 delivery for arresting bearish risks in the major trend. The short leg is likely to hedge potential slumps and the momentary upside risks can be arrested by the long leg. Thereby, one could be able to directionally position in their FX exposures on hedging grounds. Courtesy: Scotiabank







