


 FxWirePro: AUD/USD retreats slightly but trend is still bullish
  FxWirePro- Woodies Pivot(Major)
  FxWirePro: GBP/AUD positions for another drop, eyes 1.8900level
  Bitcoin’s Volatile Reset: ETFs Rebound as Bulls Eye USD 80,000 Milestone
  FxWirePro: EUR/CAD gains ground on prospects of resumed energy flows
  FxWirePro: USD/CAD recovers slightly but bearish outlook persists
  FxWirePro: EUR/AUD downtrend loses steam but outlook still bearish
  FxWirePro: GBP/NZD down trend loses steam, remains on bearish path
  FxWirePro- Major Crypto levels and bias summary
  FxWirePro: USD/CNY neutral in the near-term, scope for downward resumption
  FxWirePro: USD/JPY holding bid into weekend
  FxWirePro- Major Pair levels and bias summary
  FxWirePro:NZD/USD uptrend loses momentum but bullish setup remains
  FxWirePro: GBP/USD bulls remain cautiously optimistic
  Ethereum Consolidates: Bullish Technicals Point to a Potential $3,000 Breakout


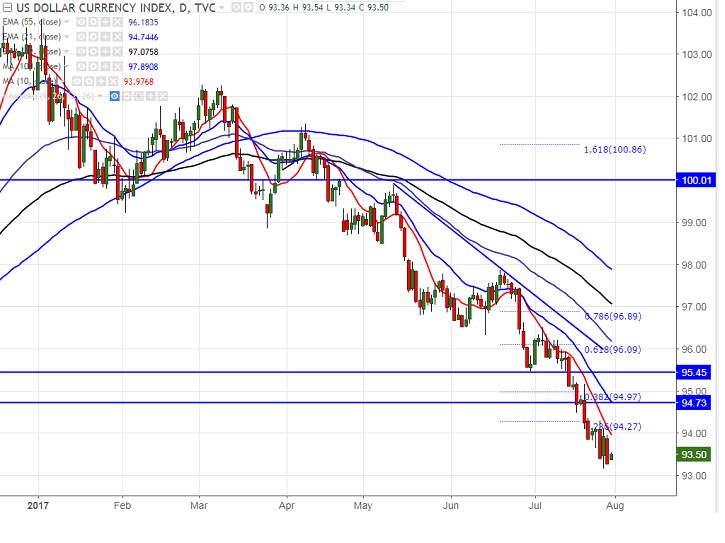
- U.S dollar index has slightly declined after hitting high of 93.95 yesterday. It is currently trading around 93.48.
- In the daily chart, index upside capped by 10 day MA at 94.15 and any break above will take the DXY till 94.86 (21- day EMA)/95.36 (daily Kijun-Sen).
- On the lower side, any close below 93 will drag the index till 90 in the short term.
- Short term bearish invalidation only above 97.87.
It is good to sell on rallies around 9375-93.80 with SL around 94.35 for the TP of 93/91.95.


