Home / Technicals / Article Technicals
Add as a preferred source on Google FxWirePro: US Dollar Index Daily Outlook US Dollar index is trading in narrow range between 92.66 and 91.58 for the past three trading session. It is currently trading around 91.75. Short term bullishness can be seen only above 92.36- 92.60 (daily Kijun-Sen, 20…
By FxWirePro Team Sep 20, 2017, 12:49 PM UTC
Image from the original EconoTimes article Read the original article
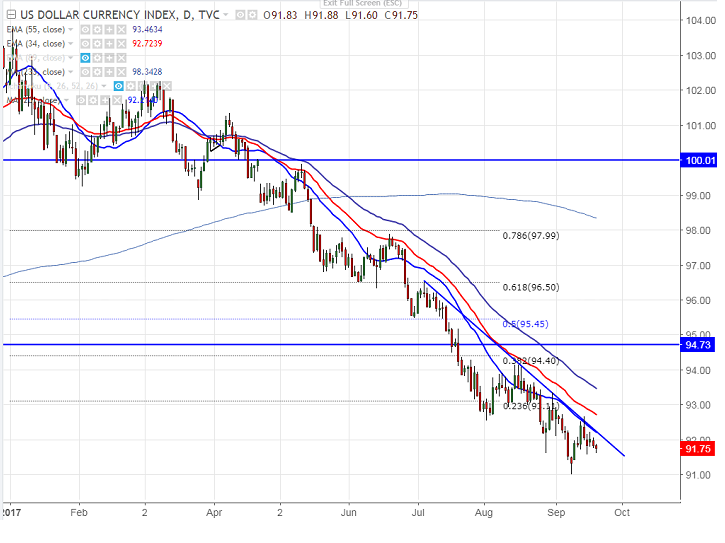
US Dollar index is trading in narrow range between 92.66 and 91.58 for the past three trading session. It is currently trading around 91.75.
Short term bullishness can be seen only above 92.36- 92.60 (daily Kijun-Sen, 20- day MA and trend line resistance).
Any violation above 92.60 will take the pair to next level 93.11/93.60/94.15/95 in the short run. The minor resistance is around 91.82/92.27.
The index major support is at 91 low made yesterday and break below targets 90.
It is good to sell on rallies around 92.20-92.25 with SL around 92.66 for the TP of 91
Technicals EURUSD - Levels to watch - 1.1100 GBPUSD Levels to watch - 1.3180 USDCHF Levels to watch - 0.8365 USDCAD - Levels to watch - 1.4300 AUDUSD - Levels to watch - 0.7000 NZDUSD - Levels to watch - 0.5560
By FxWirePro Team Oct 15, 2026, 3:20 AM UTC
Technicals EURUSD - Levels to watch - 1.100 GBPUSD Levels to watch - 1.3180 USDCHF Levels to watch - 0.8400 USDCAD - Levels to watch - 1.4300 AUDUSD - Levels to watch - 0.7000 NZDUSD - Levels to watch - 0.5560
By FxWirePro Team Oct 15, 2026, 3:17 AM UTC
Technicals JPY Major Pair Currency Score: USDJPY, GBPJPY and AUDJPY Extremely Bearish
By FxWirePro Team Oct 15, 2026, 2:34 AM UTC