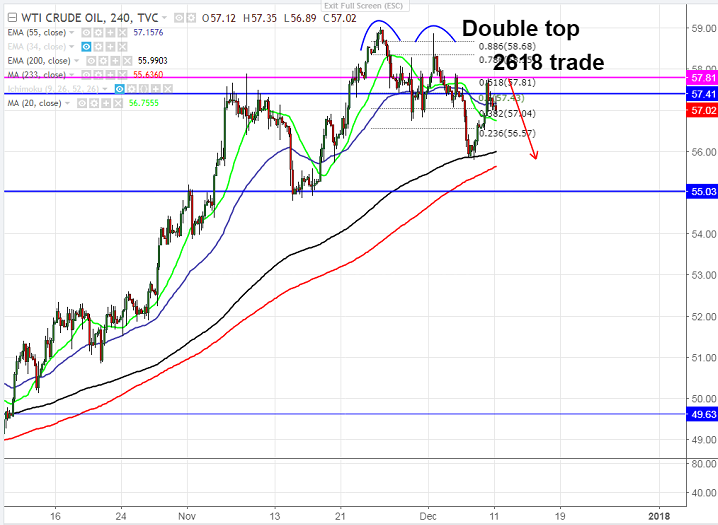
Chart pattern – 2618 US oil formed a temporary top around $59.02 and started to decline from that level. The main reason for decline in oil price was increase of shale production in U.S. The commodity declined till $55.7…
US oil formed a temporary top around $59.02 and started to decline from that level. The main reason for decline in oil price was increase of shale production in U.S. The commodity declined till $55.79 on Dec 7th 2017 and shown a minor recovery till $57.74. It is currently trading around $57.05.
The number of rigs rose by 2 in the week of Dec 8 to 751, highest level since Sep. The increase in rig count signifies rise in oil production.
Technically, the pair jumped till 61.8% retracement of $59.02 and $55.79 and started to decline from that level. Minor bullishness can be seen above $57.75 (61.8% fibo) and any break above will take the commodity to next level till $59.02. It should break above $59.02 for major trend reversal.
On the lower side, near term support is around $57 and any violation below will drag the commodity till $55.79/$55.
It is good to sell on rallies around $57.40-45 with SL around $58 for the TP of $55.79/$55.