Home / Technicals / Article Technicals
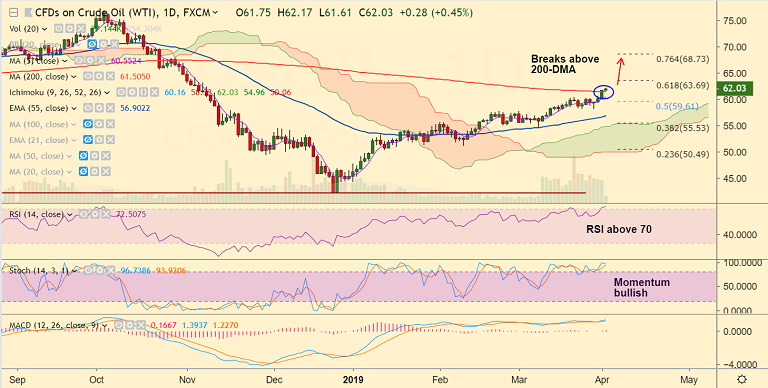
Add as a preferred source on Google FxWirePro: U.S. oil breaks above 200-DMA, hits 21-week high above 62 mark, momentum studies bullish U.S. oil chart - Trading View U.S. oil hits 21-week highs at 62.17 before paring some gains to hover around 62 mark at 1130 GMT. Speculations of the US sanctions on Iran are keeping oil markets supported. Price has breac…
By FxWirePro Team Apr 2, 2019, 11:55 AM UTC
Image from the original EconoTimes article Read the original article
U.S. oil chart - Trading View
U.S. oil hits 21-week highs at 62.17 before paring some gains to hover around 62 mark at 1130 GMT.
Speculations of the US sanctions on Iran are keeping oil markets supported.
Price has breached the 200-day simple moving average (SMA) for the first time since October 2018.
Oscillators are at highly overbought levels, but we do not see major signs of reversal.
Scope for test of 61.8% Fib at 63.69. Retrace below 200-DMA could see test of 5-DMA at 60.53.
Support levels - 61.50 (200-DMA), 60.52 (5-DMA), 59.61 (50% Fib)Resistance levels - 62.55 (Upper BB - weekly), 63, 63.69 (61.8% Fib)For details on FxWirePro's Currency Strength Index, visit http://www.fxwirepro.com/currencyindex .
Technicals EURUSD - Levels to watch - 1.1100 GBPUSD Levels to watch - 1.3180 USDCHF Levels to watch - 0.8365 USDCAD - Levels to watch - 1.4300 AUDUSD - Levels to watch - 0.7000 NZDUSD - Levels to watch - 0.5560
By FxWirePro Team Oct 15, 2026, 3:20 AM UTC
Technicals EURUSD - Levels to watch - 1.100 GBPUSD Levels to watch - 1.3180 USDCHF Levels to watch - 0.8400 USDCAD - Levels to watch - 1.4300 AUDUSD - Levels to watch - 0.7000 NZDUSD - Levels to watch - 0.5560
By FxWirePro Team Oct 15, 2026, 3:17 AM UTC
Technicals JPY Major Pair Currency Score: USDJPY, GBPJPY and AUDJPY Extremely Bearish
By FxWirePro Team Oct 15, 2026, 2:34 AM UTC