


 FxWirePro: GBP/NZD gains some ground but bias is still bearish
  FxWirePro: GBP/AUD downside pressure builds, key support level in focus
  FxWirePro: AUD/USD dips after RBA Governor speech
  JPY Action Bias: Bullish Pairs to Watch Out For
  GBPJPY Slips After Sterling Weakness, Bears Eye 216
  AUDJPY Action Bias: Bullish Dip-Buy Setup Despite Flat Neutral Bias
  Crypto Action Bias: ETHUSD Stands Out as the Bullish Pair to Watch
  NZDJPY Action Bias: Bullish Dip-Buying Opportunity on Broad Yen Weakness
  EUR/USD Bounces from Monthly Low, But Bearish Pressure Remains
  Major Pairs Action Bias: USDCAD and USDCHF Stand Out as Extremely Bullish While GBPUSD and NZDUSD Turn Extremely Bearish
  FxWirePro: EUR/NZD downside pressure builds, key support level in focus
  FxWirePro: USD/ZAR retreats but trend is still bullish
  FxWirePro : USD/JPY holds relatively bid on 163 ahead Of FOMC,BoJ meetings
  JPY Action Bias: USDJPY Emerges as the Clear Bullish Pair to Watch Amid Mixed Crosses
  FxWirePro: NZD/USD edges lower, remains on back foot
  FxWirePro :USD/JPY eases slightly, remains on bullish path


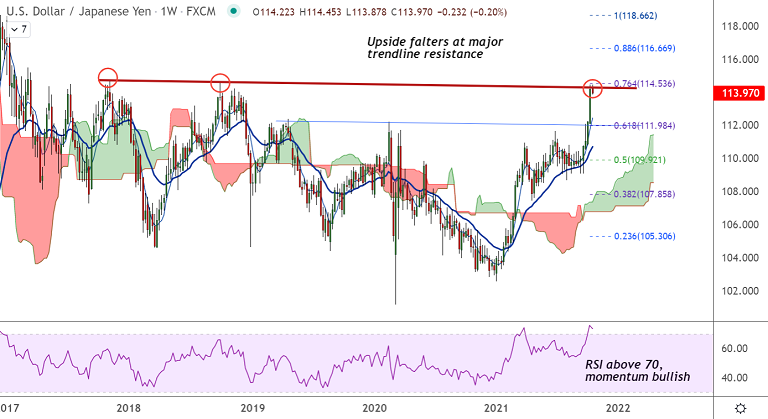
USD/JPY chart - Trading View
Technical Analysis: Bias Neutral
- USD/JPY was trading 0.14% lower on the day at 114.15 at around 11:00 GMT
- Upside in the pair falters at major trendline resistance at 114.30 mark
- The pair looks set to snap a 6-week winning streak
- 5-DMA has turned flat and any close below will see more weakness
- Major trend on the daily and weekly charts as evidenced by GMMA indicator remain bullish
- 200H MA is strong support at 113.26, retrace below will change near-term dynamics
Support levels - 113.92 (5-DMA), 113.26 (200H MA), 112.32 (21-EMA)
Resistance levels - 114.30 (major trendline), 114.53 (76.4% Fib), 115
Data Watch:
| Time (GMT) | Event | Forecast |
Previous |
| 1230 | US Building Permits (MoM)(Sep) | 1.68M | 1.728M |
| 1230 | US Housing Starts (MoM)(Sep) | 1.62M | 1.615M |
| 1255 | US Redbook Index (YoY)(Oct 15) | - | 14.8% |
| 1715 | Fed's Bowman speech | ||
| 1900 | Fed's Waller speech | ||
| 2350 | Japan Merchandise Trade Balance Total(Sep) | ¥-519.2B | ¥-637.2B |
| 2350 | Japan Imports (YoY)(Sep) | 34.4% | 44.7% |
| 2350 | Japan Exports (YoY)(Sep) | 11% | 26.2% |
Summary: USD/JPY is trading with a neutral bias. Watch out for close below 5-DMA for further weakness. Dip till 113.25 likely.


