


 FxWirePro: GBP/NZD downside pressure builds, key support levels in focus
  FxWirePro: GBP/AUD under pressure as pound continues to weaken
  NZDJPY Pullback: Sell Rallies Toward 93.30 as Yen Weakness Eases
  NZDJPY Action Bias: Bullish Dip-Buying Opportunity on Broad Yen Weakness
  JPY Action Bias: Bullish Pairs to Watch Out For
  FxWirePro: AUD/USD gains on Iran-US truce hopes, risk rally
  FxWirePro: AUD/USD dips after RBA Governor speech
  FxWirePro: GBP/AUD downside pressure builds, key support level in focus
  FxWirePro :USD/JPY eases slightly, remains on bullish path
  FxWirePro- Woodies pivot (Major)
  AUDJPY Action Bias: Bullish Dip-Buy Setup Despite Flat Neutral Bias
  FxWirePro: USD/CAD positions for another climb, eyes 1.4150 level
  FxWirePro: EUR/NZD up trend gains momentum but hurdles ahead
  FxWirePro : USD/JPY holds relatively bid on 163 ahead Of FOMC,BoJ meetings
  FxWirePro: USD/ZAR uptrend loses steam, remains on bullish path
  GBPJPY Slips After Sterling Weakness, Bears Eye 216
  FxWirePro- Major Crypto levels and bias summary


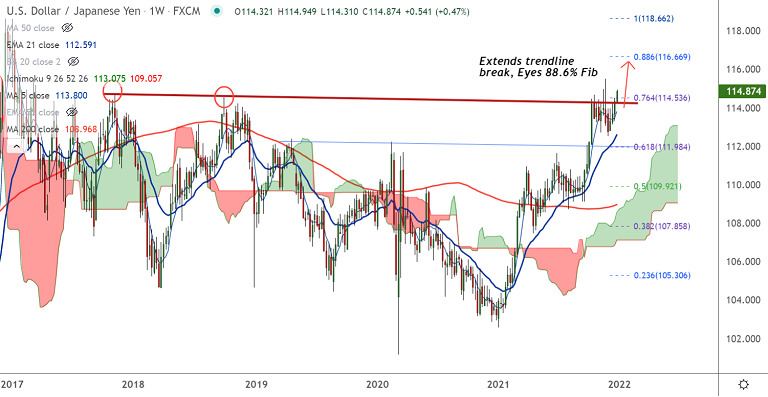
Chart - Courtesy Trading View
Technical Analysis: Bias Bullish
GMMA Indicator
- Major and minor trend are strongly bullish
Ichimoku Analysis
- Price action has bounced off daily cloud support
- Chikou span is biased higher
Oscillators
- Stochs and RSI are sharply higher, momentum is bullish
- Stochs are at overbought levels, but no signs of reversal seen
Bollinger Bands
- Bollinger bands are spread wide apart and gap is increasing
- Volatility is high and rising, could carry the bullish momentum
Major Support Levels: 114.50 (5-DMA), 114.01 (21-EMA), 113.89 (Nearly converged cloud and 50-DMA)
Major Resistance Levels: 115, 115.52 (Nov high), 116
Summary: USD/JPY is set to close higher on the day, bias is strongly bullish. Scope for test of 115 levels.


