


 FxWirePro- Woodies pivot (Major)
  FxWirePro: GBP/NZD gains some ground but outlook is bearish
  BTC, ETH, SOL, XRP, and BNB: Major Crypto Pairs Stay Neutral
  JPY Action Bias: USDJPY, EURJPY, and CADJPY Emerge as Top Extremely Bullish Picks
  FxWirePro: USD/ZAR retreats slightly but bias is bullish
  FxWirePro: USD/CNY edges higher but bulls lack punch
  FxWirePro:USD/JPY hovers near a four-decade low
  FxWirePro: USD/CAD edges lower but bullish outlook persists
  Crypto Bias Report: Trend Signals and Top Bullish Picks
  FxWirePro- Major Crypto levels and bias summary
  FxWirePro: USD/CAD positions for another climb, eyes 1.4150 level
  FxWirePro: GBP/NZD downside pressure builds, key support levels in focus
  EUR/USD Slides After ECB Hold, Bearish Technicals Favor Rally Fades
  FxWirePro: EUR/NZD downside pressure builds, key support level in focus
  FxWirePro: USD/ZAR surges as rand slumps after SARB rate hold surprise
  FxWirePro: EUR/NZD firms after ECB holds rates steady at 2.25%
  Major Pairs Action Bias: USDCHF Emerges Extremely Bullish as EURUSD and GBPUSD Turn Deeply Bearish


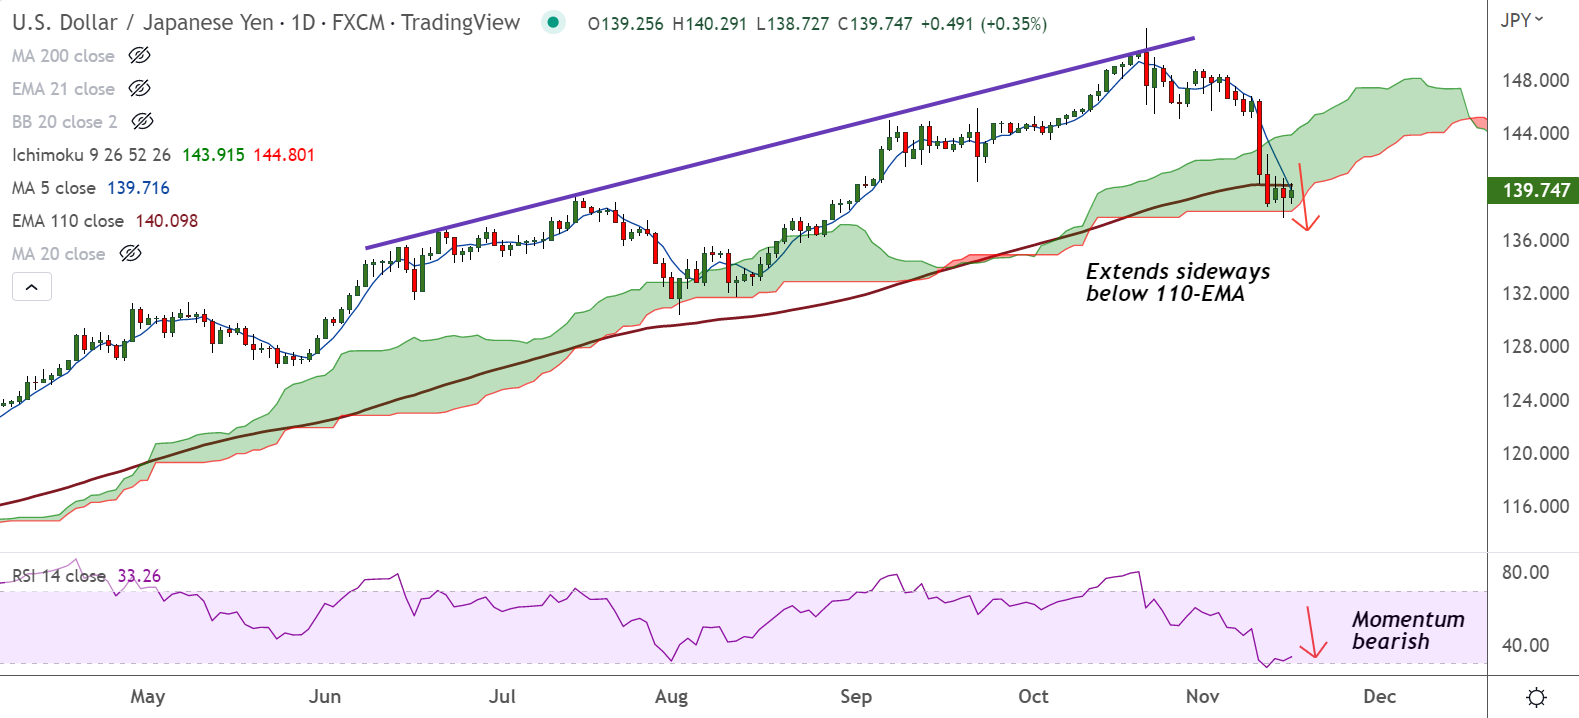
Chart - Courtesy Trading View
Spot Analysis:
USD/JPY was trading 0.39% higher on the day at 139.80 at around 06:35 GMT.
Previous Week's High/ Low: 147.56/ 138.45
Previous Session's High/ Low: 140.62/ 137.65
Fundamental Overview:
Investors stay on a cautious footing amid rising geopolitical risks as concerns loom over missile attack on Poland.
Data released on Tuesday showed US Producer Price Index (PPI) for October eased to 8.0% YoY versus market forecasts of 8.3% and the downwardly revised prior of 8.4%.
The monthly figure reprinted the 0.2% prior (revised from 0.4%) while easing below 0.5% expectations.
Further, the Federal Reserve Bank of New York's Empire State Manufacturing Index jumped to 4.5 in November from -9.1 in October and the market expectation of -5.
Softer data stoke receding hawkish bets at the US central bank’s next move in December. Focus now on US Retail Sales for impetus.
US Retail Sales for October scheduled at 13:30 GMT later in the NY session are expected to rise to 1.0% versus 0.0% prior.
Technical Analysis:
- USD/JPY finds stiff resistance at 110-EMA
- Momentum is bearish, stochs and RSI are sharply lower
- Volatility is high and rising, MACD and ADX support downside in the pair
- GMMA indicator shows major trend is neutral, while minor trend is bearish
Major Support and Resistance Levels:
Support - 138.48 (Lower BB), Resistance - 140.09 (110-EMA)
Summary: USD/JPY has paused downside. Pullback from multi-year highs seems to be fizzling out. Retrace above 200H MA will see upside resumption. Sideways grind likely to continue till pairs shows decisive break above 110-EMA.


