


 FxWirePro: GBP/USD rises as soft US data pressures dollar
  Major FX Action Bias & US Market Sentiment: NZD/USD (Extremely Bullish) & AUD/USD (Bullish) Watchlist
  FxWirePro: USD/ZAR gains as stronger dollar outweighs upbeat South Africa's trade surplus
  FxWirePro: AUD/USD gains some ground but outlook is bearish
  FxWirePro: GBP/AUD bears maintain upper hand
  AUD/JPY Slips Below 112 as BOJ Intervention Sparks Bearish Momentum: Sell the Rallies
  US Magnificent 7 Stocks Trend Score: Amazon & Microsoft Hit Extreme Bullish (+100) as Meta Drops to -100 — Key Resistance & Support Watchlist
  FxWirePro- Major Crypto levels and bias summary
  US Magnificent 7 Stocks Trend Score: Amazon & Microsoft Hit Extreme Bullish (+100) as Meta Drops to -100 — Key Resistance & Support Watchlist
  FxWirePro: GBP/AUD drifts lower after BOE rate decision
  FxWirePro: EUR/ AUD dips below 1.6400 level, focus on near term support
  FxWirePro- Major Pair levels and bias summary
  FxWirePro- Major Crypto levels and bias summary
  Major European Indices Score Extremely Bullish: DAX Eyes 26000, CAC Targets 8600, FTSE100 at 11000 – Key Levels to Watch
  NZDJPY Retreats on Yen Strength – Bearish Setup Targets 90 After Hitting 92.75 Low
  FxWirePro- Woodies pivot (Major)
  AUDJPY Volatile After Massive Sell-Off: Sell Rallies at 113, Targeting 110 as Bearish Momentum Surges


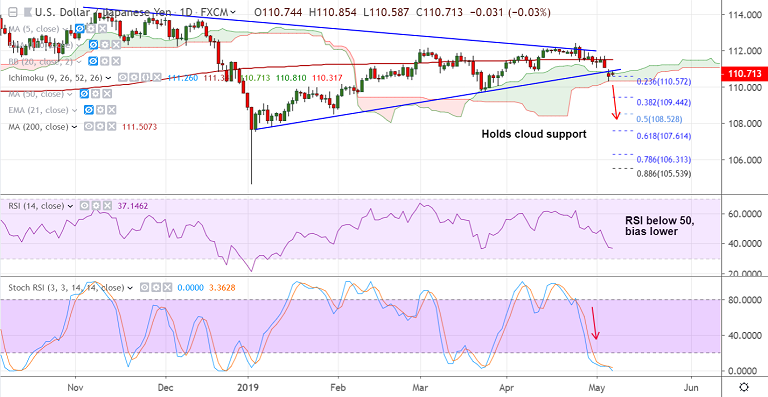
USD/JPY chart - Trading View
- USD/JPY depressed below cloud top, bias remains bearish.
- The major failed to extend break above 200-SMA on the daily and weekly charts.
- Price action has slipped below major EMAs and technical indicators have turned bearish.
- Volatility rising on the daily charts and momentum with the bears. MACD and DMI support downside.
- Break below daily cloud will see weakness till 109.44 (38.2% Fib). Bearish invalidation above 200-DMA.
- Focus on BoJ minutes and March JOLTS job openings. The employment data could rise to 7.240 million from 7.087 million previous.
Support levels - 110.31 (cloud base), 110, 109.44 (38.2% Fib)
Resistance levels - 111.08 (5-DMA), 111.25 (55-EMA), 111.50 (200-DMA)
For details on FxWirePro's Currency Strength Index, visit http://www.fxwirepro.com/currencyindex.


