
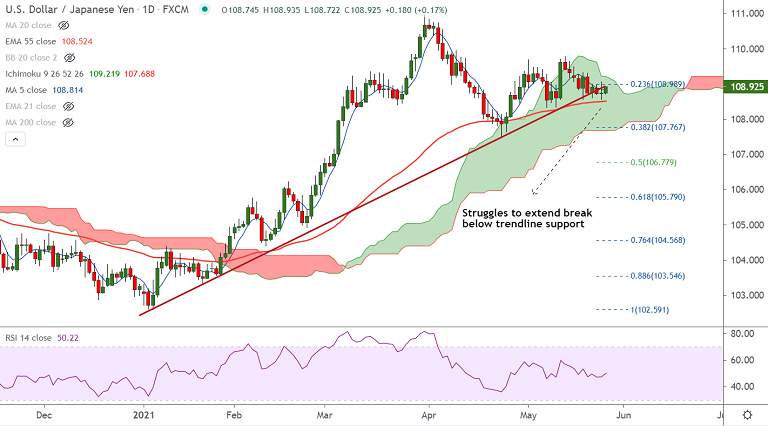
USD/JPY chart - Trading View
Spot Analysis:
USD/JPY was trading 0.11% higher on the day at 108.86 at around 09:00 GMT
Previous Session's High/Low: 109.07/ 108.55
Previous Week's High/Low: 109.50/ 108.57
Fundamental Overview:
An modest uptick in the US Treasury bond yields extended some support to the US dollar
On the other side, risk-on mood undermined the safe-haven JPY aiding the intraday move up
That said, dovish Fed expectations keep the bulls from placing aggressive bets and hence limit gains
Technical Analysis:
- The major is extending choppy trade along 200-week MA
- Price action is grinding sideways above 55-EMA support
- Analysis of GMMA indicator shows major and minor trend are neutral
- Price action is within daily cloud and breakout will provide clear directional bias
Major Support and Resistance Levels:
Support - 108.52 (55-EMA), 108, 107.62 (110-EMA)
Resistance - 109 (200H MA), 109.21 (Cloud top), 110
Summary: USD/JPY trades with a neutral bias. Price action fails to extend break below trendline support. Doji limits downside. With no major data aligned for the day, risk catalysts to determine price action.


