


 AUDJPY Weakness Deepens: Sell Rallies Toward 112 as Aussie Dollar Falters
  FxWirePro: USD/CAD positions for another climb, eyes 1.4150 level
  FxWirePro: USD/CAD gaining momentum for a move towards 1.4200 level
  FxWirePro : USD/JPY holds relatively bid on 163 ahead Of FOMC,BoJ meetings
  FxWirePro: EUR/AUD outlook weaker on renewed downside pressure
  FxWirePro: GBP/AUD under pressure as pound continues to weaken
  FxWirePro: EUR/NZD up trend gains momentum but hurdles ahead
  Major Pairs Action Bias: USDCAD and USDCHF Stand Out as Extremely Bullish While GBPUSD and NZDUSD Turn Extremely Bearish
  FxWirePro: AUD/USD gains on Iran-US truce hopes, risk rally
  FxWirePro- Major Crypto levels and bias summary
  FxWirePro: NZD/USD edges lower, remains on back foot
  FxWirePro: USD/CNY dips as yuan firms on improving risk appetite
  FxWirePro: GBP/NZD downside pressure builds, key support levels in focus
  FxWirePro: AUD/USD dips after RBA Governor speech
  FxWirePro: GBP/NZD gains some ground but bias is still bearish
  GBPJPY Slips After Sterling Weakness, Bears Eye 216


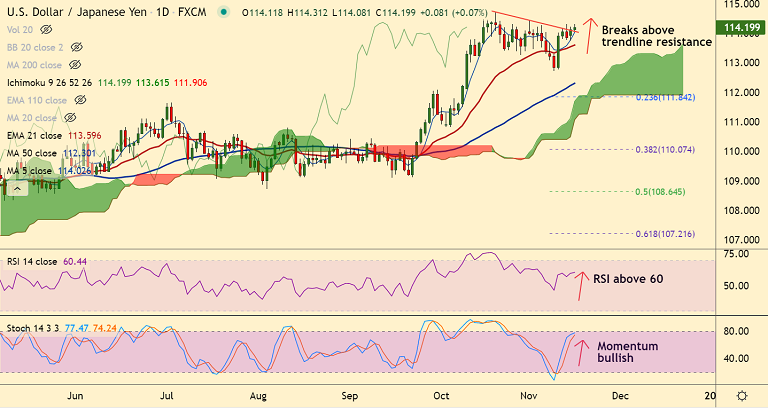
Chart - Courtesy Trading View
Spot Analysis:
USD/JPY was trading 0.06% higher on the day at 114.18 at around 06:30 GMT.
Session's High/ Low: 114.31/ 114.08
Previous Week's High/ Low: 114.30/ 112.72
Previous Session's High/ Low: 114.21/ 113.75
Technical Analysis:
GMMA Indicator
- Long and near term moving averages are sharply higher, suggest bullish bias
Ichimoku Analysis
- Price action is well above daily cloud
- Chikou span is biased higher
Oscillators
- Stochs and RSI show bullish momentum
Bollinger Bands
- Bollinger bands are flat on daily charts, volatility is high on the weeklies
Major Support Levels: 114.02 (5-DMA), 113.59 (21-EMA)
Major Resistance Levels: 114.50 (Upper BB), 114.69 (Oct 20 high)
Summary: USD/JPY trades with a bullish bias, poised for further upside. Next bull target lies at 114.70. Bullish invalidation only below 21-EMA.


