


 FxWirePro: AUD/USD climbs as US-Iran peace deal sparks risk rally
  FxWirePro- Woodies pivot (Major)
  Ethereum Cracks Under $1,700: Sell the Rally Near $1,750 as Bears Eye $1,380–$1,200
  FxWirePro- Woodies pivot (Major)
  FxWirePro: AUD/ USD strongly bearish despite upside attempts
  FxWirePro: GBP/AUD eases on Geopolitical whipsaw
  Sell the Bounce: NZDJPY Bearish Bias Persists Below 94.20, Eyes 90.50
  Peace Dividend Powers NZDJPY Past 93.50 — Bulls Set Sights on 96.15 Target
  FxWirePro: GBP/NZD stuck in range but outlook is bullish
  FxWirePro- Major Crypto levels and bias summary
  BTC’s Bear Bounce: Sell the Rally Near $66K as Bears Target $59K–$52K Breakdown
  FxWirePro: USD/JPY gains above 160 level ahead of BOJ policy meeting


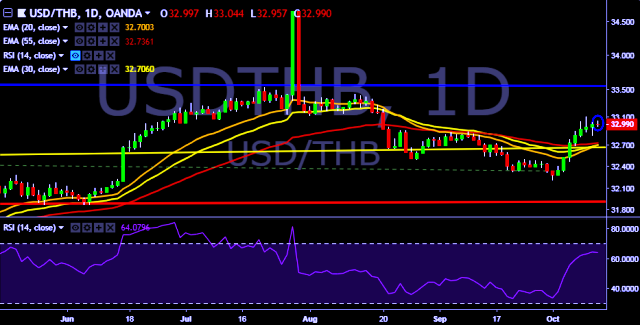
- USD/THB is currently trading around 32.98 marks.
- It made intraday high at 33.04 and low at 32.95 marks.
- Intraday bias remains neutral till the time holds key resistance at 33.05 mark.
- On the top side, key resistances are seen at 33.05, 33.20, 33.37, 33.52, 33.78 and 33.96 marks respectively.
- Alternatively, a daily close below 32.99 will drag the parity down towards key supports around 32.81, 32.68, 32.46, 32.27, 32.18, 32.02 and 31.85 marks respectively.
- Important to note here that 20D, 30D and 55D EMA heads down and confirms the bearish trend in a daily chart. Current upside movement is short term trend correction only.
We prefer to take long position on USD/THB only above 33.05, stop loss 32.81 and target of 33.20/33.37.


