


 Relief Rally Extends to 112.75, but AUDJPY EMA Structure Favors Selling
  FxWirePro- Major Crypto levels and bias summary
  GBPJPY Coil Tightens: Is a Bullish Break Above 215.60 Imminent?
  FxWirePro: NZD/USD jumps after US and Iran agree preliminary deal
  FxWirePro: GBP/NZD stuck in range but outlook is bullish
  FxWirePro: GBP/AUD runs out of steam but maintains bullish outlook
  FxWirePro: AUD/USD climbs as US-Iran peace deal sparks risk rally
  FxWirePro: USD/ZAR edges higher, set to stay on back foot
  FxWirePro- Woodies pivot (Major)
  FxWirePro- Woodies pivot (Major)
  FxWirePro: USD/ CNY falls towards 6.750, bears keep the advantage
  Ethereum Cracks Under $1,700: Sell the Rally Near $1,750 as Bears Eye $1,380–$1,200
  FxWirePro: USD/JPY gains above 160 level ahead of BOJ policy meeting
  FxWirePro: GBP/USD range-bound as Iran uncertainty keeps traders cautious


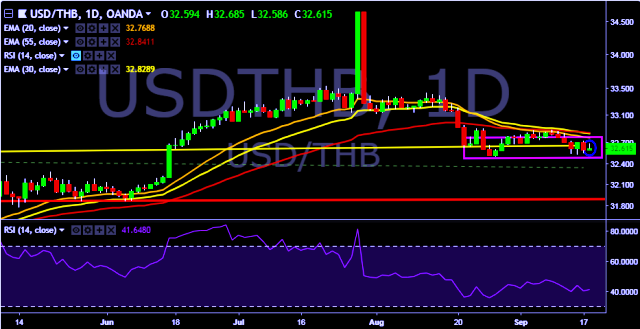
- USD/THB is currently trading around 32.60 marks.
- It made intraday high at 32.68 and low at 32.58 marks.
- Intraday bias remains neutral till the time pair moves in stiff boundaries from 32.90 to 32.50 marks.
- On the top side, key resistances are seen at 32.90, 32.90, 33.05, 33.20, 33.37, 33.52, 33.78 and 33.96 marks respectively.
- Alternatively, a daily close below 32.50 will drag the parity down towards key supports around 32.18, 32.02 and 31.85 marks respectively.
- Important to note here that 20D, 30D and 55D EMA heads down and confirms the bearish trend in a daily chart.
We prefer to take long position on USD/THB only above 32.90, stop loss at 32.50 and target of 33.52.


